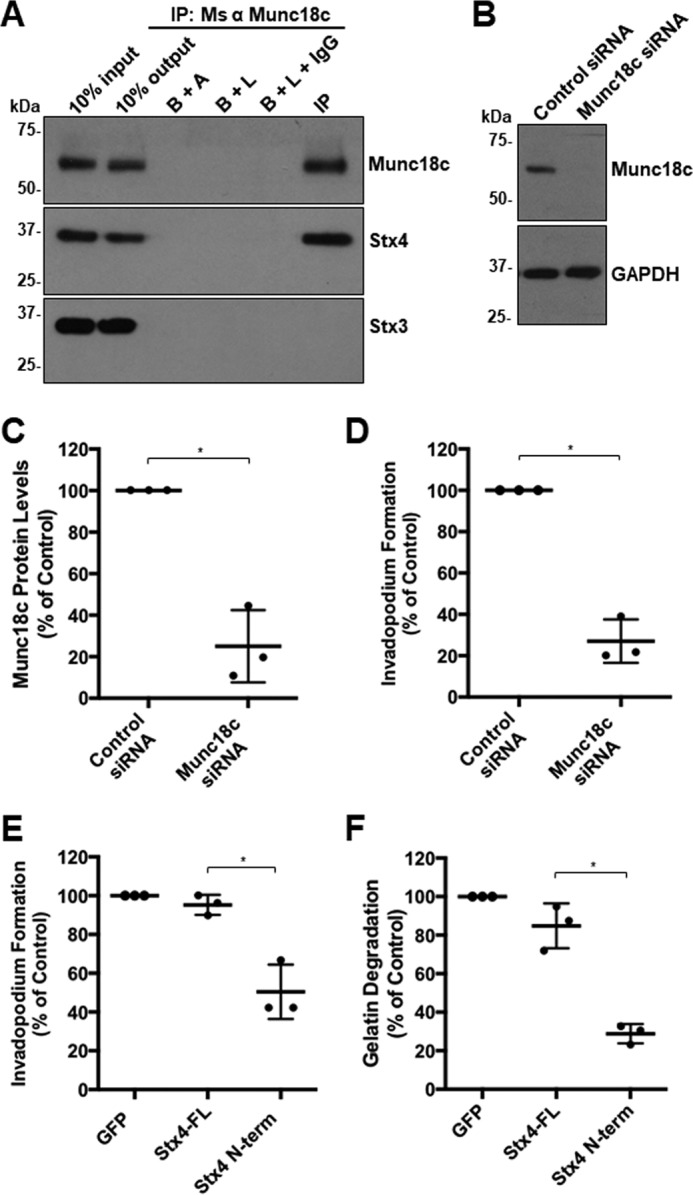
Figure 8.

Inhibition of expression and function of Munc18c shows a conserved phenotype in HT-1080 cells. A, Munc18c immunoprecipitates (IP) were probed for Munc18c and Stx4. B+A, beads plus antibody; B+L, beads plus lysate; B+L+IgG, beads plus lysate plus unrelated IgG. B, HT-1080 cells were transfected with siRNA targeting Munc18c or nonspecific control siRNA, lysed, and analyzed for Munc18c by SDS-PAGE/Western blotting. C, quantification of Munc18c knockdown normalized to GAPDH. D, quantification of invadopodium formation. Cells were transfected with siRNA targeting Munc18c or nonspecific control siRNA for 44 h and then plated onto fluorescent gelatin for 4 h. Cells with F-actin puncta overlying dark spots of gelatin degradation were counted as cells forming invadopodia. Percentages of cells forming invadopodia are shown from three independent experiments in which 50 cells/sample were counted and normalized to parental MDA-MB-231 cells. E, invadopodium-based degradation of Alexa Fluor 594 gelatin by cells transfected with GFP (control), GFP-Stx4-FL, or GFP–Stx4–N-term. Cells were transfected for 20 h, seeded onto fluorescent gelatin for 4 h, and then fixed, permeabilized, stained for F-actin, and analyzed by confocal microscopy. Percentages of cells forming invadopodia are shown from three independent experiments in which 50 cells/sample were counted and normalized to GFP-expressing cells. F, cells were transfected with GFP (control), GFP-Stx4-FL, or GFP–Stx4–N-term for 24 h, plated onto fluorescent gelatin for 24 h, and then fixed. Cells were analyzed for dark areas of degradation and scored as described under “Gelatin degradation assay.” Percentages of cells degrading gelatin are presented as the mean ± S.D. from three independent experiments in which 50 cells/sample were analyzed. Asterisks denote values significantly different from control (*, p < 0.05). All treatments are a percentage of GFP alone, which was used as the control group. All data represent three or more biological replicates with at least three technical replicates.
