Figure 7.
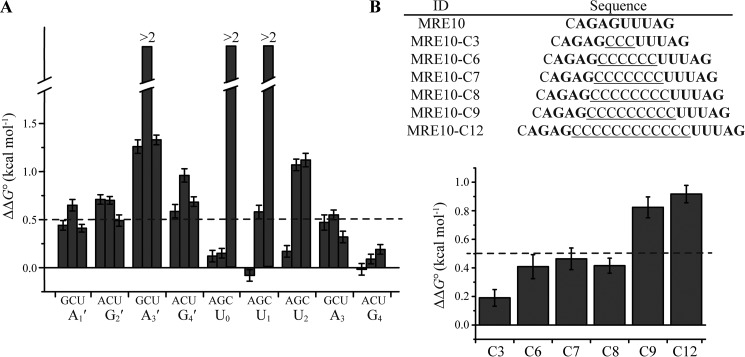
Mutagenesis of MRE10 RNA. A, the MRE10 RNA was mutated systematically, and the Kd value for every single-nucleotide mutation was determined by ITC experiment. The change of standard free energy change is defined as ΔΔG0 = −RTln(1/Kd,mut) − [−RTln(1/Kd,wt)]. The bars represent the ΔΔG0 value, and the single-nucleotide mutants are indicated on the horizontal axis. The broken bars indicate the mutants that can hardly bind to hMEX-3C. B, upper, the RNA sequence of MRE10 and a series of spacing mutants with the background of cytosine are shown. The hMRE motif are shown in bold. Lower, the Kd value for each spacing mutant was determined by ITC experiment. The bars represent the ΔΔG0 value, and the spacing mutants are indicated on the horizontal axis. The error bars represent S.D.

