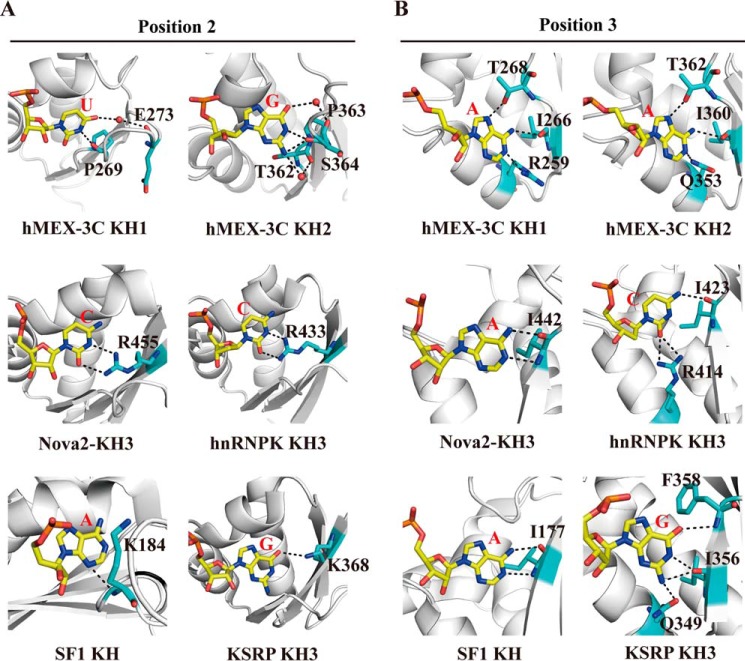
Figure 9.
Comparison of the hydrogen bonds pattern in the central positions of hMEX-3C KH1–GUUUAG/KH2–CAGAGU complexes with other representative KH–nucleic acid complexes. A and B, comparison of the hydrogen bonds pattern in position 2 (A) and in position 3 (B). The residues involved in hydrogen-bonding interactions are labeled and shown as sticks.

