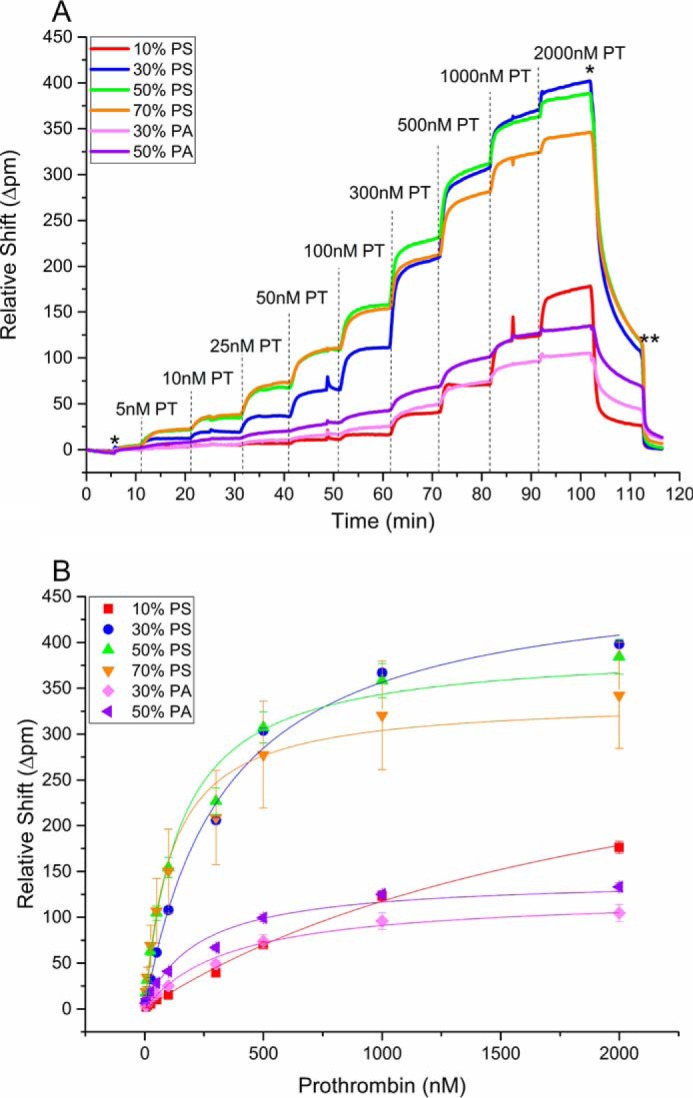
Figure 1.

A, real-time shifts in resonance wavelength during PT Kd titration at different nanodisc compositions. The dashed lines indicate the addition of a new concentration of protein of interest; *marks the transition to HEPES buffer, and ** marks the transition to HEPES(−). Minimal binding to the 100% PC microrings were subtracted from the other responses to account for nonspecific binding. The different concentrations of PT (ranging from 50 to 2000 nm) flowed across the sensor array at different times are indicated. B, plots of relative wavelength shift as a function of PT concentration. In each panel, the error bars represent the standard deviation from at least n = 8 microrings in a single detection experiment.
