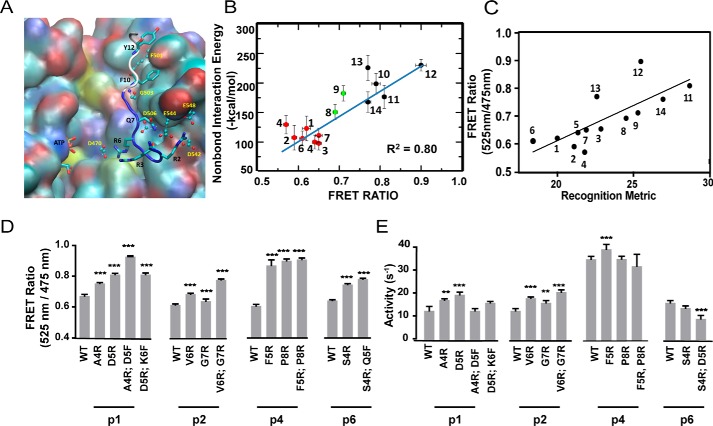
Figure 2.
Electrostatic interactions between residues in the N terminus of the peptide substrate and the kinase catalytic domain are major determinants of binding strength. A, predicted binding site of the tight binding peptide substrate p12 in PKCα. The backbone atoms of the residues before the Ser that gets phosphorylated in the substrate p12 are shown in blue and the residues after Ser are shown in white. The residues in the peptide substrate are shown in sticks. The residues in PKCα that make strong contact with the peptide are shown in ball and sticks. B, calculated average interaction energy of the N terminus of the peptide substrates with PKCα versus FRET intensity ratio. For clarity, the weak, medium, and strong binding peptide substrates are shown in red, green, and black spheres, respectively. The error bars for FRET measurement and the non-bond interaction energy represent the mean ± S.E. and the standard deviation, respectively. C, FRET ratio of SPASM sensors show a linear correlation with a recognition metric derived by Nishikawa et al. (14). D, site-directed mutagenesis of residues in peptides p1, p2, p4, and p6 identified from the MD simulation analysis to improve the binding affinity. Mutagenesis of N-terminal residues to Arg enhances kinase-substrate interaction as measured by FRET ratio. E, kinase activity of mutant peptide substrates shown in D. Mutagenesis of N-terminal residues to Arg marginally increase kinase specific activity compared with wild-type counterparts. The FRET results are expressed as mean ± S.E. of three independent experiments performed in triplicate (n ≥ 9). *, p < 0.05; **, p < 0.005; ***, p < 0.0005; ****, p < 0.0001.

