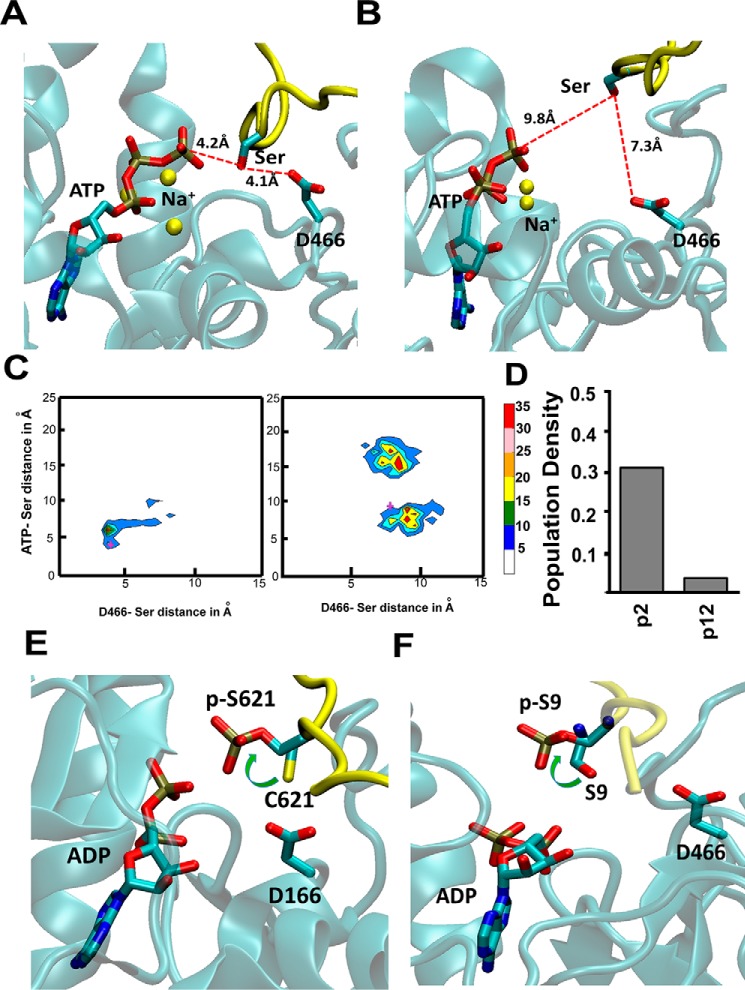
Figure 3.
High activity peptides populate catalytically favorable conformations when bound to the kinase. A and B, snapshots from MD trajectories showing the plausible catalytic conformation of the high activity peptide p2 (A) and low activity peptide p12 (B), bound to PKCα. These snapshots were selected based on the shortest distance between the Ser in the substrate to Asp466 that abstracts the proton from Ser and also to the γ-PO4 group of the ATP. C, population distribution of various peptide conformations from three 100-ns all-atom MD trajectories for peptide substrates p2 and p12. The MD ensemble was clustered by two distances. The distance between ATP(γP) and S/T(OG) of the substrate peptide and between D466(OD) and S/T(OG). The cross marks in these two figures are the conformations for which these distances are shown in A and B. D, population density of the catalytic conformations as captured in the MD simulations. We used a cutoff of 4.2 Å in the ATP(γP) and S/T(OG) distance and 4.1 Å in the D466(OD) and S/T(OG) distance to calculate this population density. E, rotamer flip change in the χ1 angle of the pSer/Thr in peptide substrates as seen from crystal structures before (PDB code 4XW5, PKA) and after (PDB code 4IAK, PKA) the phosphoryl transfer. F, all-atom MD simulations after the PO4 transfer was done showed a rotamer flip in pSer in the good activity peptide substrate p1 after the PO4 transfer to the pSer in the peptide. The panel shows the most populated rotamer of Ser/Thr in the simulations of the peptide p1 before and after the PO4 transfer. The peptide backbone is colored in yellow and the Ser and pSer are shown in sticks.

