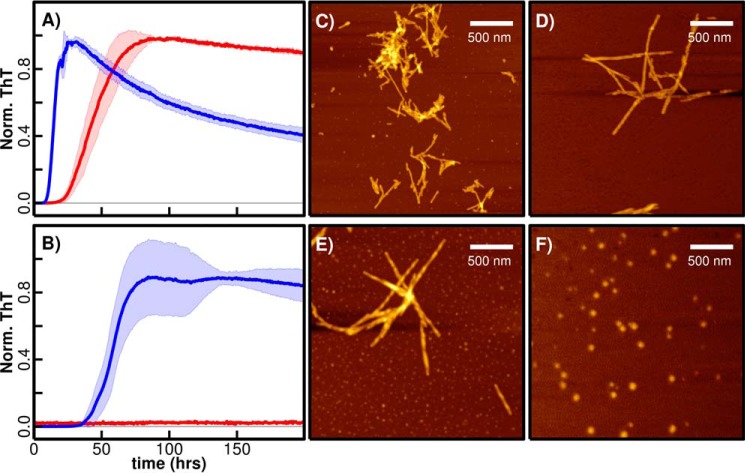
Figure 2.
pH-dependent ThT fibrillation of αS and βS and AFM imaging. 1 mg/ml αS (A) and βS (B) were incubated at 37 °C in a plate reader, and fibril formation was monitored with a ThT-binding assay in 20 mm MES, 20 mm MOPS, 100 mm NaCl, pH 5.8 (blue), and pH 7.3 (red). Normalized average fluorescence values were used for plotting the curve, and the standard deviations calculated from at least three replicates are indicated by shading in a lighter color. The samples that did not show any fluorescence are indicated by a horizontal line for comparison. AFM imaging was carried out at the end of the fibrillation process when samples that formed fibrils reached the plateau phase. AFM images for αS at low pH 5.8 (C) and high pH 7.3 (D) showed fibrils. βS forms fibrils at pH 5.8 (E) and spherical oligomers (F) at pH 7.3. The oligomers do not exhibit fluorescence in the ThT-binding assay (B; red curve).

