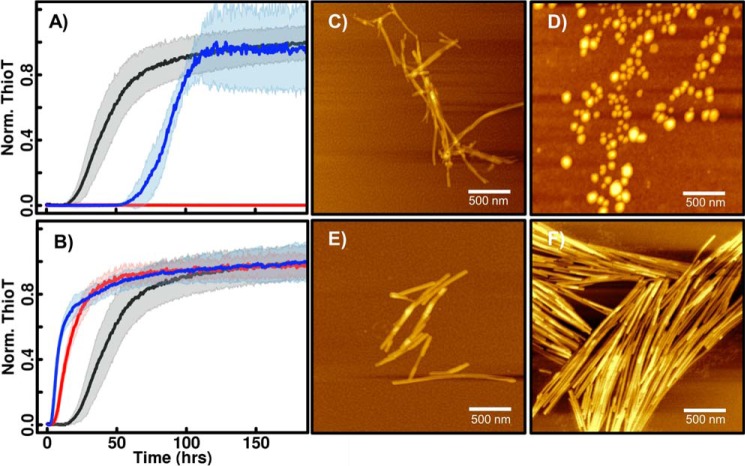
Figure 8.
ThT fluorescence and AFM images of βS mutants E31A and E61A at pH 5.8 and pH 7.3. Aggregation kinetics (as detected by ThT fluorescence) of βS mutants E31A (A) and E61A (B) at low pH (blue), high pH (red), and wild-type βS at low pH (black) are shown. At low pH, E31A shows a significantly higher lag time compared with wild-type βS. AFM images of E31A at low pH (C) and high pH (D) show fibrils and oligomers, respectively, similar to wild-type βS (Fig. 2). The E61A substitution abolishes the pH dependence for fibrillation and shows similar lag times at both pH values. Fibril morphologies at low pH (E) and high pH (F) are shown.

