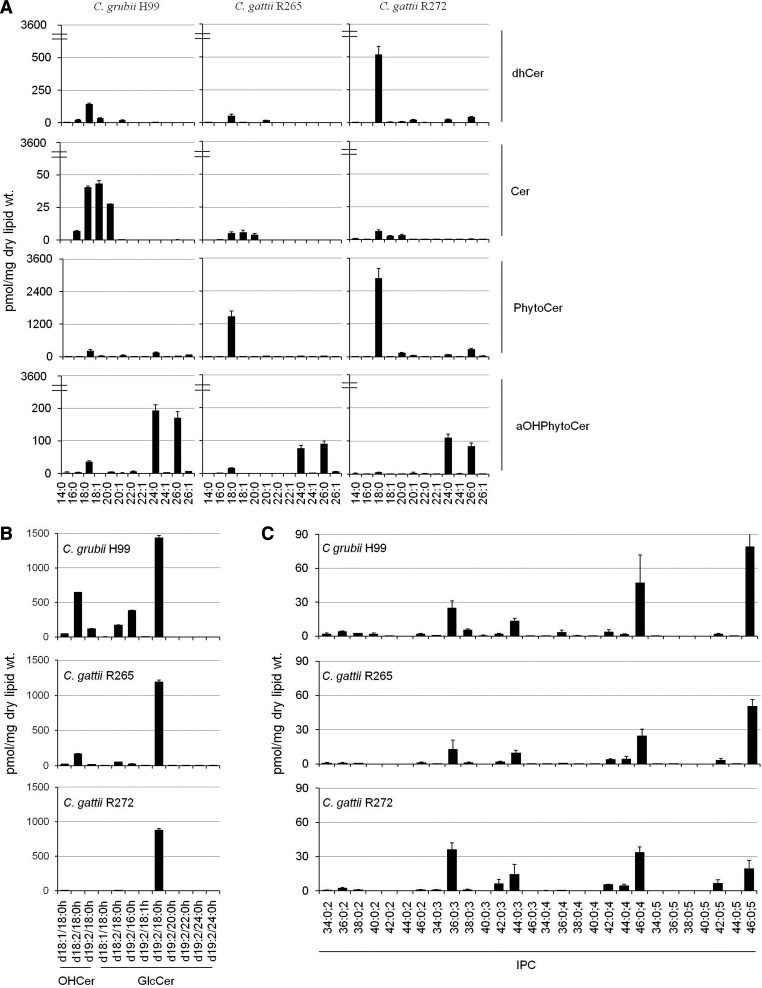
Fig. 2.
Comparative sphingolipid species analyses of C. grubii and C. gattii strains. A: Cer, dhCer, PhytoCer, and αOHPhytoCer species content in C. grubii and C. gattii strains. Plots depict sphingolipid species from 14 to 26 carbon chain lengths (x axis). B: OHCer and GlcCer species content in C. grubii and C. gattii strains. C: IPC species content in C. grubii and C. gattii strains. IPC species are represented as total number of carbons in the sphingoid base and acyl chains:total number of carbon-carbon double bonds in the sphingoid base and acyl chains;number of hydroxyl groups present in the sphingoid base and acyl chains. Mean ± SEM is shown (n = 3). Breaks in the y axis of (A) have been used for better visualization of datasets.

