Fig. 4.
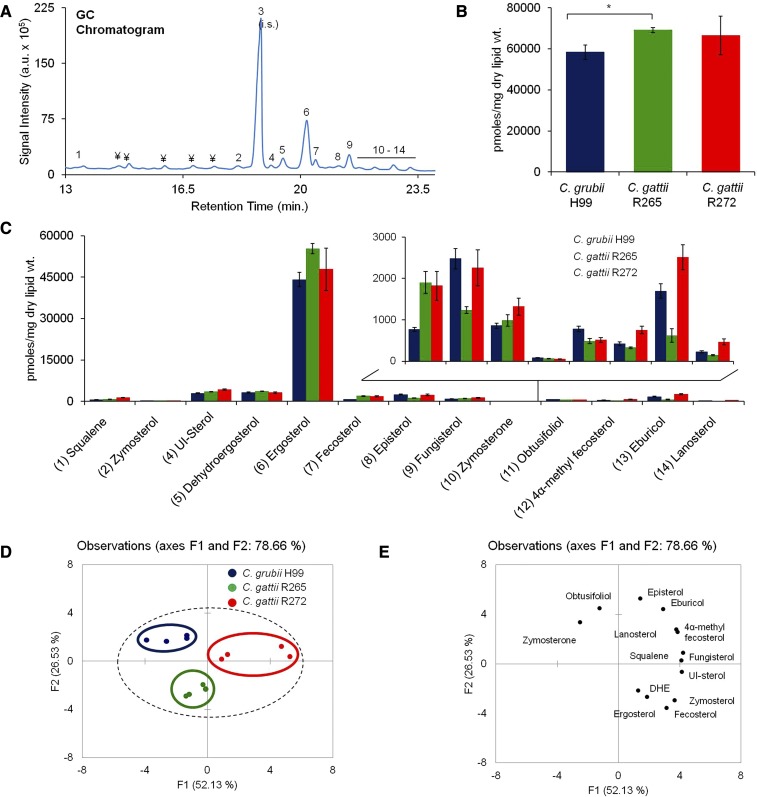
Sterol analysis of Cryptococcus by using GC-MS. A: A representative total ion chromatogram showing detection of sterols in the C. grubii strain. (1) squalene; (2) zymosterol; (3) cholesterol, internal standard; (4) unidentified sterol (UI-sterol); (5) dehydroergosterol; (6) ergosterol; (7) fecosterol; (8) episterol; (9) fungisterol; (10) zymosterone; (11) obtusifoliol; (12) 4α-methyl fecosterol; (13) eburicol; (14) lanosterol. Peaks marked with “¥” are nonsterol metabolites. B: Total sterol content in C. grubii and C. gattii strains. Mean ± SEM is shown (n = 3). *P < 0.05 (Student’s t-test). C: Sterol class composition of C. grubii and C. gattii strains. D: PCA of sterol species analyzed shows that the three replicates are grouped, C. grubii (blue), C. gattii R265 (green), C. gattii R272 (red), and that their lipid profiles are marginally different. Factors F1 (x axis) and F2 (y axis) represent the two most variable principal components. E: PCA loading plots representing the contribution of individual species to the sample variability.

