Fig. 6.
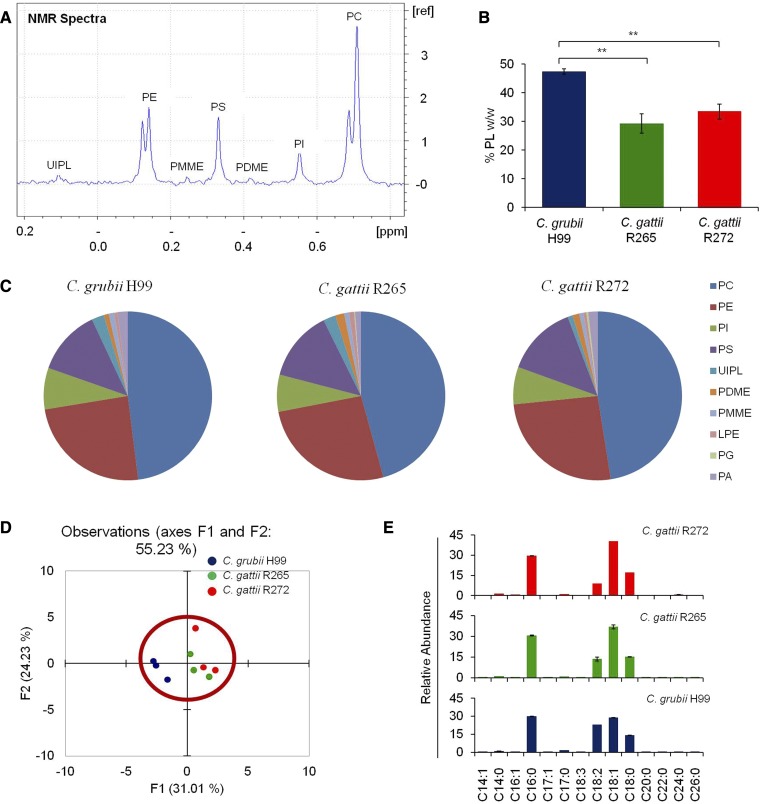
Phosphoglyceride profiling of Cryptococcus using 31P-NMR. A: A representative spectra of 31P-NMR showing detection of phospholipids in the C. grubii H99 strain. UIPL, unidentified phospholipid. B: Total phospholipid content in the C. grubii and C. gattii strains. Data represents %w/w. Mean ± SEM is shown (n = 3). **P < 0.01 (Student’s t-test). C: Phospholipid class composition of C. grubii and C. gattii strains. The percent abundance and means of three replicates are plotted. D: PCA of phospholipids shows that the three replicates are grouped, C. grubii (blue), C. gattii R265 (green), C. gattii R272 (red), and that these lipid profiles are similar. Factors F1 (x axis) and F2 (y axis) represent the two most variable principal components. E: Fatty acid composition of C. grubii and C. gattii strains as detected using GC-MS. Relative abundances of fatty acyls with 14–26 carbons are plotted as mean ± SEM (n = 3).

