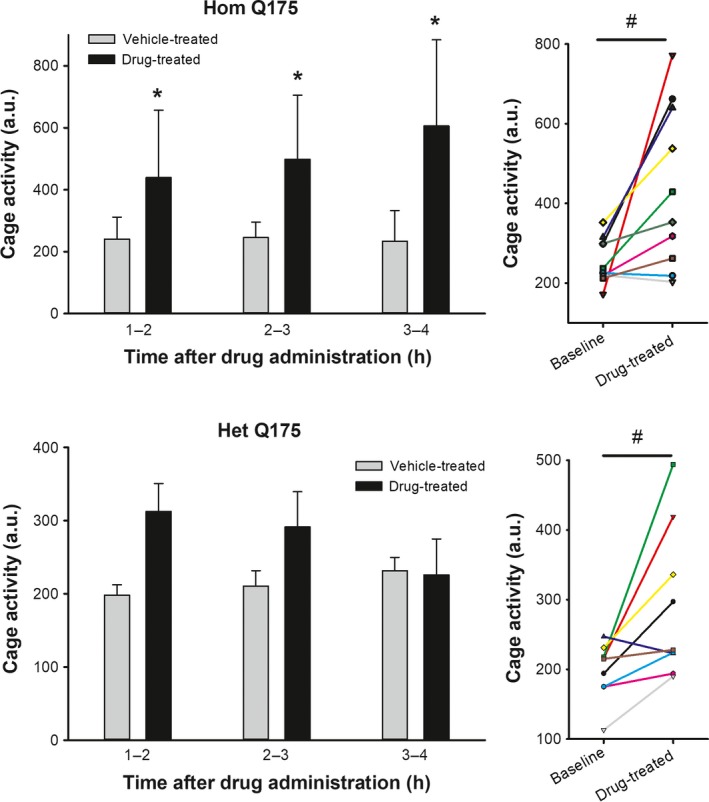
Figure 2.

Hom Q175 (top of letter “H” and numbers smudged/blurred) and y‐axis “C” in cage activity (Hom bar graph) also same. The acute oral administration of GSK189254 (3.0 mg/kg) significantly increased total cage activity measured by an IR sensor in Hom (top) and Het (bottom) Q175. Left panels illustrate the activity for the 3 h following treatment. After 4 h, activity was no longer elevated compared to vehicle controls in either genotype. Two‐way ANOVA was used to analyze the activity levels with time and treatment as factors. Asterisks represent significant differences due to drug treatment compared to vehicle‐treated controls (P < 0.05). Right panels show the values from individual animals at the same ZT on the last day of untreated acclimation compared to the first day of administration 1 h after treatment. Paired t‐test found significant (P < 0.05) impact of drug treatment on the animal's activity levels shown by a # symbol. Most, but not all, mice exhibited a significant increase in activity as a result of drug treatment.
