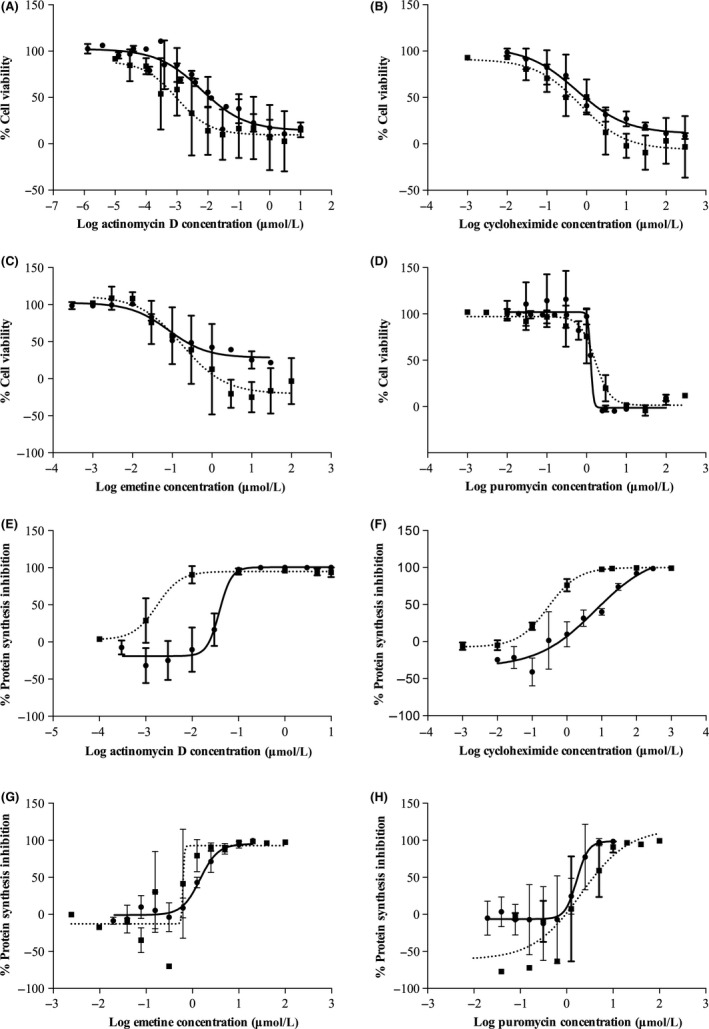
Figure 1.

IC 50 and CC 50 of the four individual protein synthesis inhibitors in HepG2 and primary rat hepatocytes (PRH). (A–D) Cell viability was measured by standard MTT assay and expressed as viability as a percentage of untreated control. (E–H) Protein synthesis inhibition across different concentrations of inhibitors was measured by [3H]‐Leucine incorporation assay and shown as percentage of inhibition of control. Dotted line shows PRH and solid line for HepG2 cells. Dose–response curves were produced by Prism software and IC 50 and CC 50 values were calculated from linear regression models. Data are shown as mean ± SD from n = 3 independent experiments.
