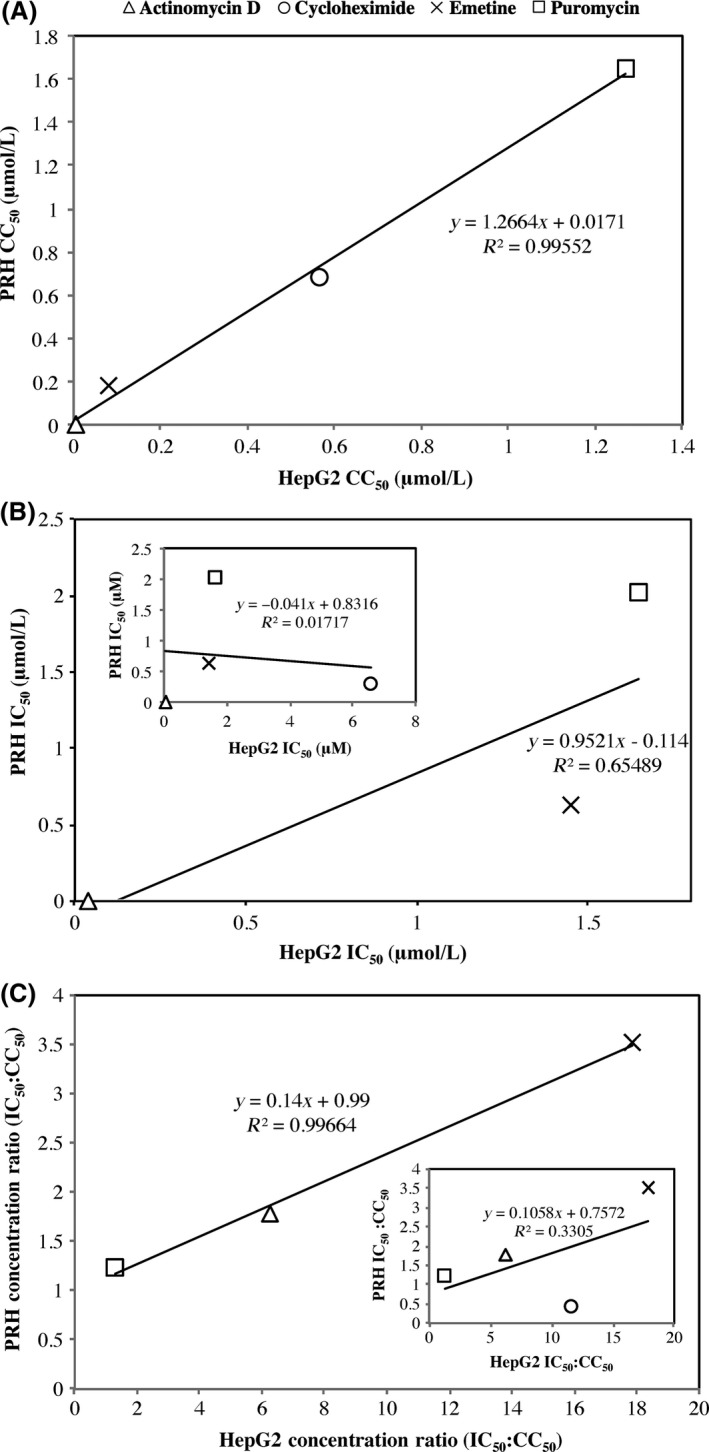
Figure 2.

Linear regression analysis of IC 50 and CC 50 between HepG2 and PRH cell types. (A) shows linear regression between CC 50 values of the four protein synthesis inhibitor drugs for the different cell types. (B) shows linear regression between IC 50 values with cycloheximide omitted but shown in inset graph, of the two cell types. (C) shows IC 50:CC 50 ratio of HepG2 and PRH cell types omitting cycloheximide. Cycloheximide is included in the inset graph.
