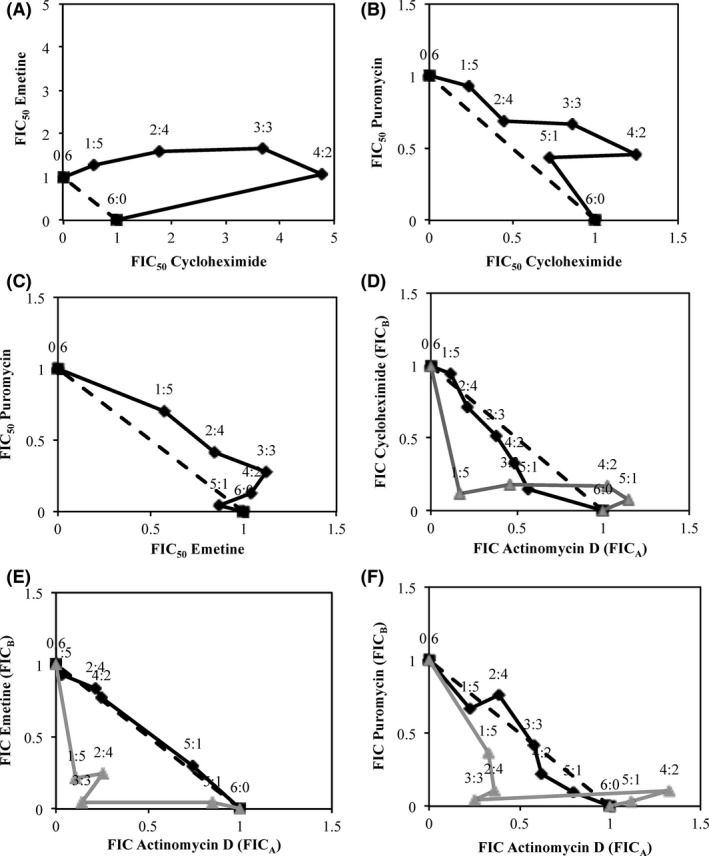
Figure 3.

Isobolograms generated based on CC 50 and IC 50 values showing the interaction between protein synthesis inhibitor pairs. Six combinations of inhibitor pairs are shown in (A–F) The dotted line corresponds to the predicted curve if drug pairs showed an additive effect. The black line corresponds to drug pair interactions for protein synthesis inhibition. The grey line shows drug pair interactions for cytotoxicity. FICA and FICB correspond to the fractional inhibitory concentrations of the first and second drugs in each drug pair listed. Cytotoxicity analysis was not performed for cycloheximide–emetine, cycloheximide–puromycin, and emetine–puromycin drug pairs (A–C) as these showed strong antagonism for protein synthesis inhibition. N = 4 independent experiments were carried out in HepG2 cells.
