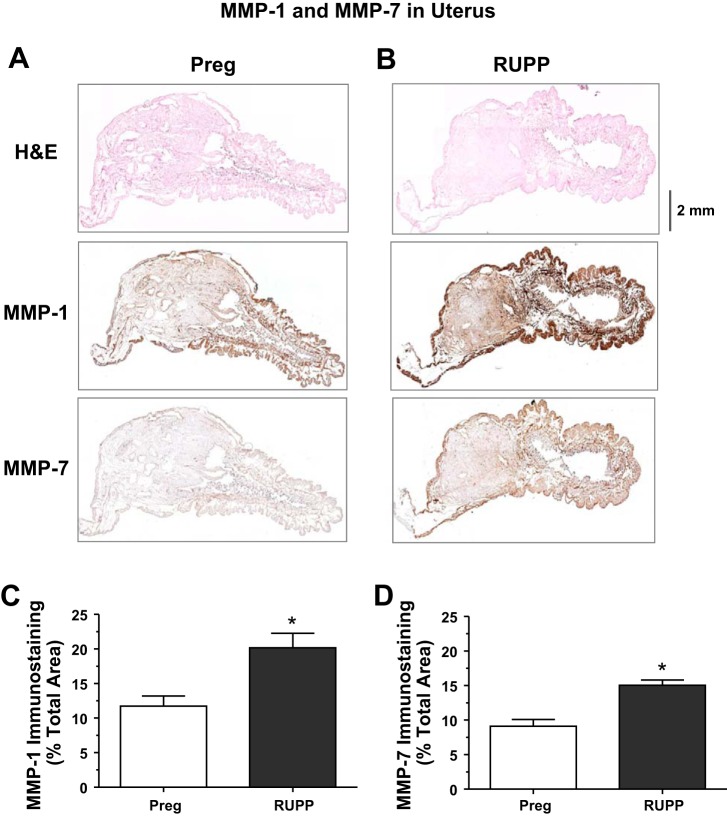
Fig. 7.
Distribution of MMP-1 and MMP-7 in the uterus of Preg and RUPP rats. Cryosections (6 μm) of the uterus of Preg (A) and RUPP rats (B) were prepared for H&E staining or immunohistochemical staining using MMP-1 or MMP-7 antibodies (1:100). Because the rat uterus is large, 10−16 picture frames of sequential parts of the uterine tissue section were acquired using a ×4 objective and inserted as individual raw images in Powerpoint. The image frames were aligned and then grouped and saved as a composite JPG image of the whole reconstituted uterine tissue section for image analysis using ImageJ software. For MMP immunostaining, the total number of pixels in the tissue section wall was first defined and the number of brown spots (pixels) was then counted and presented as a percentage of the total wall area (C and D). Total magnification: ×40. Bar graphs represent means ± SE; n = 4−6/group. *Measurements in RUPP rats were significantly different (P < 0.05) from the corresponding measurements in Preg rats.

