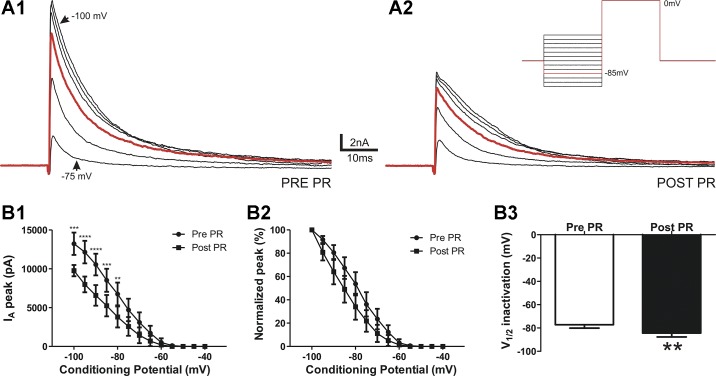
Fig. 3.
PR increases IA steady-state voltage-dependent inactivation properties. A: representative example of IA evoked by a voltage command step to 0 mV from conditioning steps between −100 and −40 mV (inset) before (1) and after PR (2). B: plots of mean IA amplitude (1) and normalized IA amplitude versus the variable inactivating conditioning potential (2). Note that PR caused a hyperpolarizing shift on the steady-state inactivation curve. B,3: mean IA V½ before and after PR application (n = 11). **P < 0.01, ***P < 0.001, and ****P < 0.0001 vs. respective pre-PR using two-way repeated-measures ANOVA followed by Bonferroni multiple comparisons; **P < 0.01 vs. pre-PR using Student’s paired t-test.

