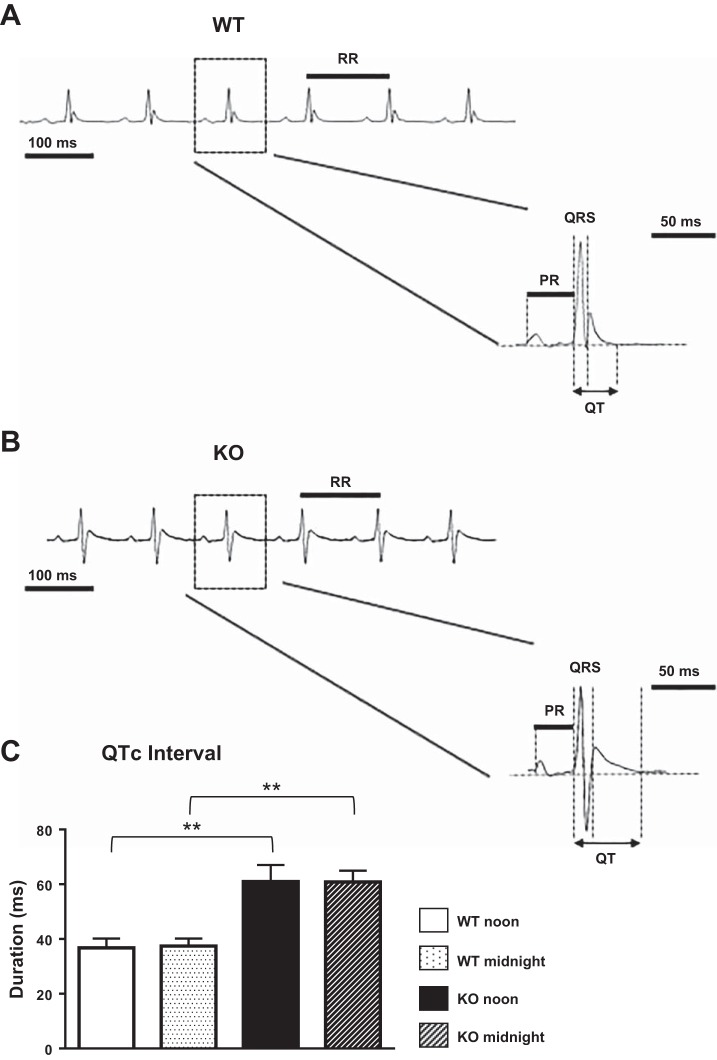
Fig. 3.
Telemetric electrocardiographic recordings. A and B: representative ECG waveforms from awake WT (A) and KO (B) animals marked with the different intervals that were measured. C: corrected QT (QTc) interval analyzed from telemetric recordings of WT (n = 4) and KO (n = 4) animals at noontime and midnight. Mean ± SE values are plotted. **P < 0.01.

