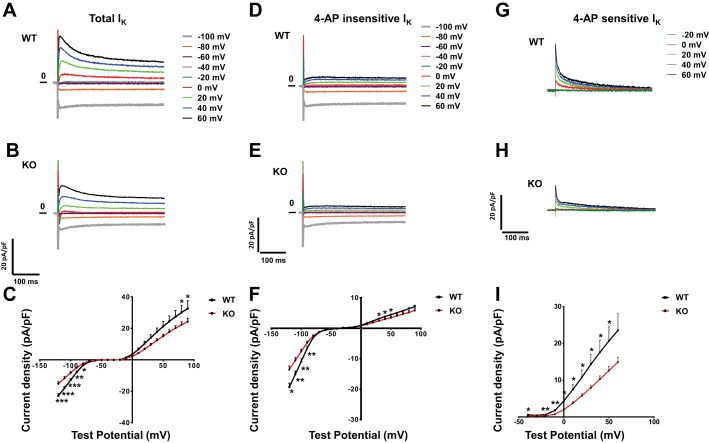
Fig. 6.
Voltage-clamp recordings of repolarizing K+ currents. A and B: representative whole cell K+ currents (normalized to membrane capacitance) recorded from WT (A) and KO (B) animals. Currents were evoked in response to (4-s) voltage steps to test potentials between −100 and 60 mV from a holding potential (Vhold) of −70 mV. C: peak outward K+ currents (normalized to membrane capacitance) recorded from WT (n = 15) and KO (n = 14) myocytes. Mean ± SE values are plotted. *P < 0.05; **P < 0.01; ***P < 0.001. D and E: representative 4-aminopyridine (4-AP)-insensitive K+ currents (normalized to membrane capacitance) recorded from WT (D) and KO (E) animals. Currents were evoked in response to (4-s) voltage steps to test potentials between −100 and 60 mV from a Vhold of −70 mV. F: peak 4-AP-insensitive K+ currents (normalized to membrane capacitance) recorded from WT (n = 13) and KO (n = 13) myocytes. Mean ± SE values are plotted. *P < 0.05; **P < 0.01. G and H: representative 4-AP-sensitive K+ currents (normalized to membrane capacitance) recorded from of WT (G) and KO (H) animals. Currents were evoked in response to (4-s) voltage steps to test potentials between −20 and 60 mV from a Vhold of −70 mV. I: peak 4-AP-sensitive K+ currents (normalized to membrane capacitance) recorded from WT (n = 9) and KO (n = 10) myocytes. Mean ± SE values are plotted. *P < 0.05; **P < 0.01.

