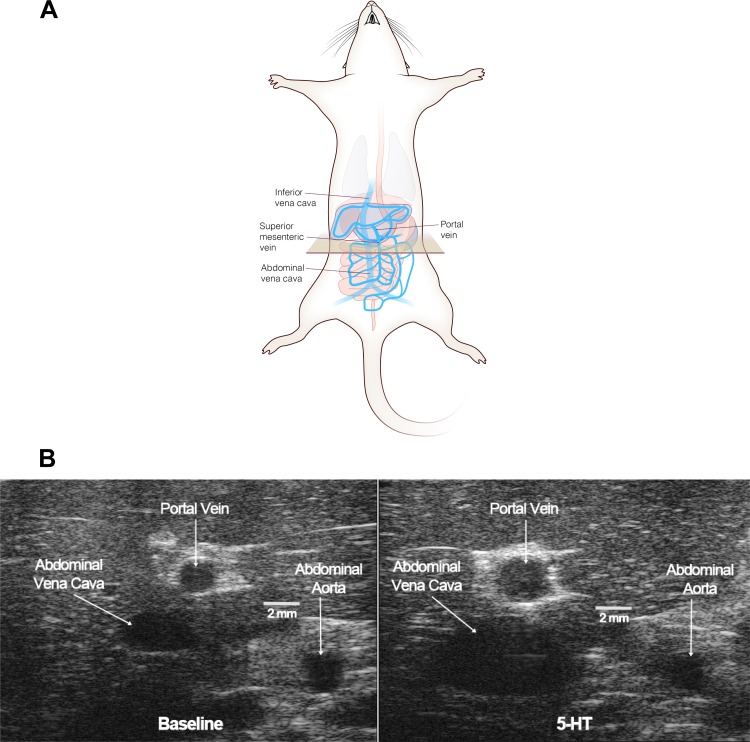
Fig. 4.
A: diagram of ultrasound wand/transducer placement for image procurement using the Vevo2100. The tan box shows the initial position of the plane imaged by the ultrasound probe. The drawing was done by Chris McKee. B: representative B-mode ultrasound images taken at baseline (left) and 24 h after 5-HT (right) in the same rat. Horizontal lines quantify size.

