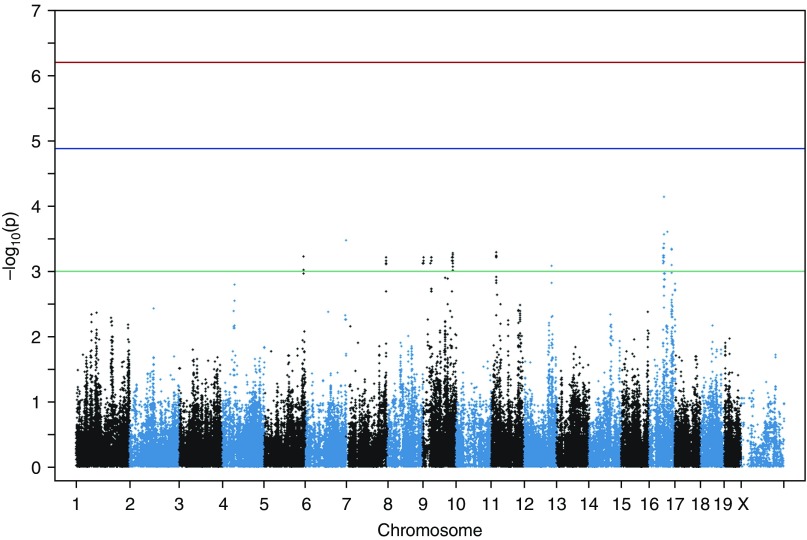
Figure 2.
Manhattan plot of associations with the log-transformed difference in chord length between mice exposed to cigarette smoke and mice exposed to room air. Each dot represents a single-nucleotide polymorphism (SNP), with its genomic location represented on the x-axis and the strength of association on the y-axis. The top threshold (red) represents genome-wide significance after Bonferroni correction of the effective number of tests, the middle threshold (blue) represents suggestive significance, and the bottom threshold (green) is drawn at P = 10−3 to demonstrate nominally associated SNPs that were used to identify candidate regions.

