. 2017 Jul 31;8(9):6670–6678. doi: 10.1039/c7sc02701j

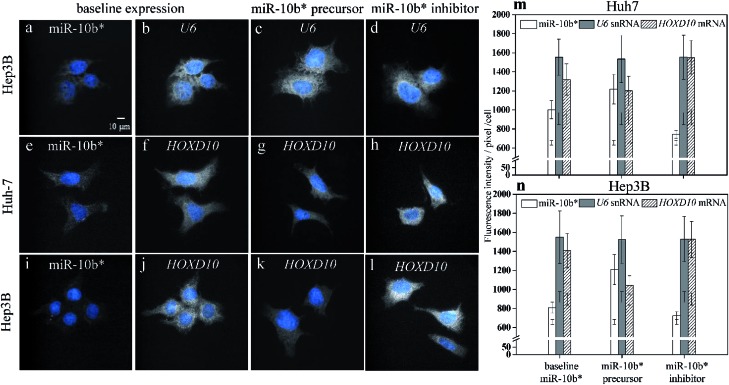
Fig. 3. Simultaneous observations of miR-10b* (a) and U6 snRNA (b–d), miR-10b (e) and HOXD10 mRNA (f–h) in the Huh-7 cells, and miR-10b (i) and HOXD10 mRNA (j–l) in the Hep3B cells using two-color illumination during the HILO microscopy. The baseline expression of miR-10b* (a, e, i) is compared to the baseline expressions of U6 snRNA (b) and HOXD10 mRNA in the Huh-7 cells (f), and HOXD10 mRNA in the Hep3B cells (j). The expression level of U6 in miR-10b* precursor-transfected (c) and in miR-10b* inhibitor-transfected cells (d) remained similar to that of the untreated cell group (b). The HOXD10 mRNA quantities decreased with increased amounts of miR-10b* (g, k), and the upregulation of HOXD10 was observed after the inhibition of miR-10b* (h, l). The bar plots show the comparison among the expressions of miR-10b* (open bars), U6 (filled bars), and HOXD10 (hatched bars) in the Huh-7 (m) and Hep3B (n) cells. Thirty-cell samples were collected from each image set (a–l) for calculations of the fluorescence intensities and standard deviations obtained using HILO microscopy. The additional error bars inside the columns (m and n) indicate the cell backgrounds at 640 nm and 488 nm illumination, respectively.

Fig. 3