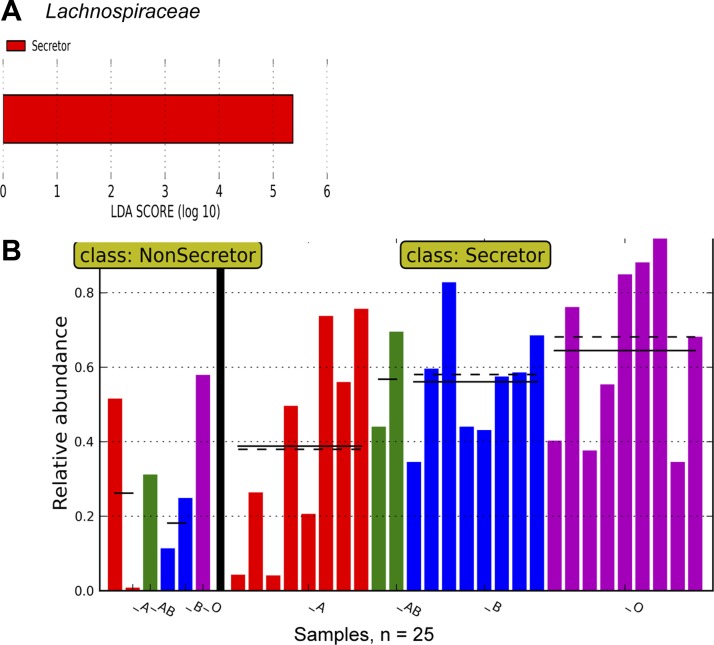
Fig. 7.
LEFSE analysis by secretor status and blood group indicates a rise in Lachnospiraceae in secretors and variation in Lachnospiraceae abundance by blood group among the secretors. A: the results of LEFSE analysis when both secretor status (primary grouping) and blood group (subgrouping) are taken into account in the analysis, and the linear discriminant analysis (LDA) score (log 10) in secretors vs nonsecretors is shown, depicting an increased relative abundance of Lachnospiraceae. B: the relative abundance of Lachnospiraceae in all samples. Each column represents the relative abundance in a single sample. y-Axis represents the relative abundance (i.e., percent abundance) value. The nonsecretor subjects are shown to the left of the graph, and the secretor subjects are shown to the right. Samples from individuals with blood group A are colored red, those with blood group AB are colored green, those with blood group B are colored blue, and those with blood group O are colored magenta. Lachnospiraceae are least abundant in A-secretors with an increasing abundance in B-secretors and the highest abundance in O-secretors. The continuous and dotted black horizontal lines represent mean and median abundance values, respectively.

