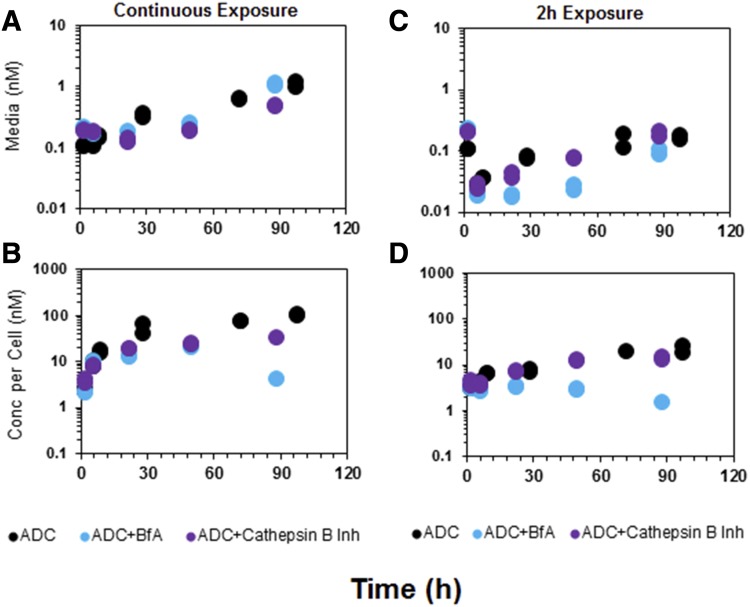
Fig. 4.
Formation of unconjugated MMAE in the media (A and C) and cellular space (B and D) of GFP-MCF7 cells after incubation with 75 nM T-vc-MMAE. Black symbols represent control group, purple symbols represent the cells that were pretreated with specific cathepsin B inhibitor, and blue symbols represent the cells that were pretreated with bafilomycin A1.

