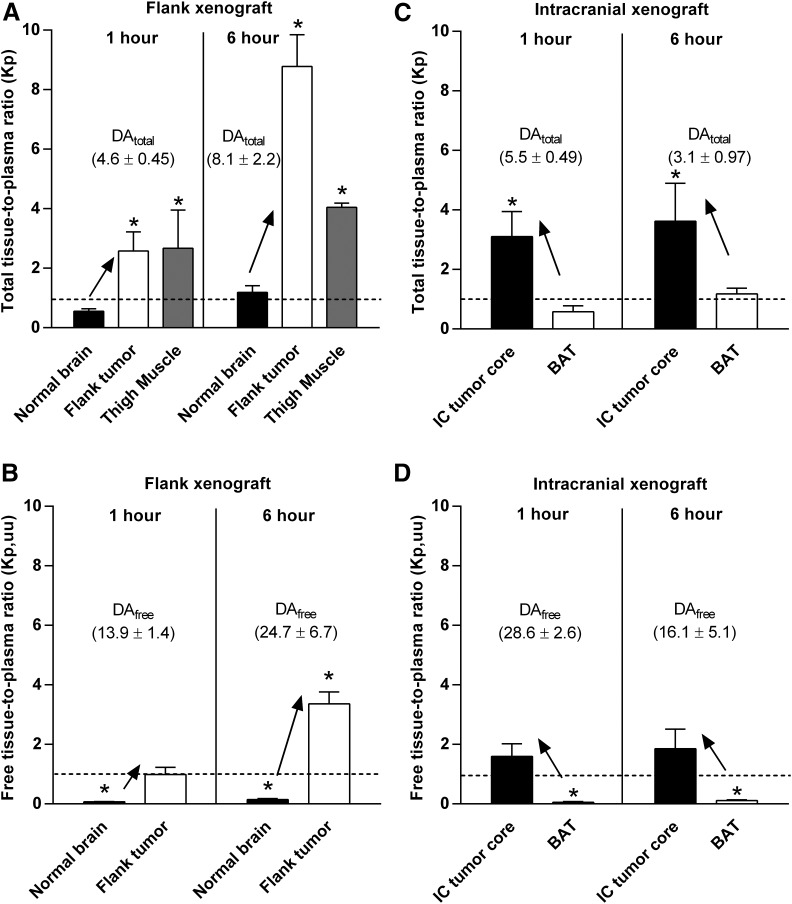
Fig. 7.
Total and free tissue-to-plasma ratios (single time point Kp and Kp,uu, respectively) at 1 and 6 hours after administration of a single oral dose (30 mg/kg) of ponatinib in GBM6 flank and intracranial xenograft mice for tumor distribution studies. (A) Kp in normal brain, flank tumor, and thigh muscle (noncancerous) in flank xenograft mice (N = 4–6). (B) Kp,uu in normal brain and flank tumor in flank xenograft mice (N = 4–6). Kp (C) and Kp,uu (D) in the intracranial tumor core (IC tumor core) and BAT in intracranial xenograft mice (N = 3–4). One-sample t tests were performed to compare the experimental values of tissue partition coefficients (Kp and Kp,uu) with the hypothetical value of 1 at a significance level of 0.05 (*P < 0.05). Dotted lines represent unity (Kp or Kp,uu at 1). The upward arrows and the listed DA values (DAtotal or DAfree) indicate the higher tissue partition coefficients (Kp or Kp,uu) in the flank tumor versus normal brain in the flank xenograft mice, and those in the IC tumor core versus BAT in the intracranial xenograft mice. Data are presented as the mean ± S.D.

