
Figure 7. Collective motion simulated by particle-based models.
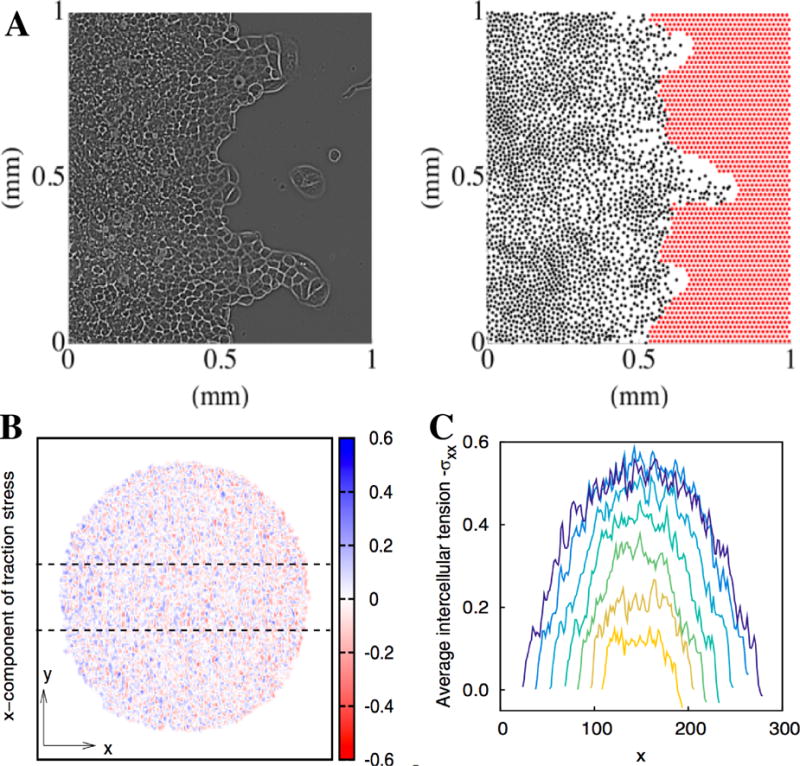
A. Experimental (left) and simulation (right) snapshot of an epithelial cell layer invading a void. The experimental picture is shown 20h after after removing the barrier and clearly shows a finger-like protrusion. In the simulation snapshot, cells are represented as black dots. For further details, see Ref. [13]. B. Snapshot of the x component of the traction stress in a simulation of a spreading cell colony using a two-particle-per cell model [47]. C. Average tension in the x direction calculated by integrating average traction stress along the y axis within the region indicated by dotted lines in B.