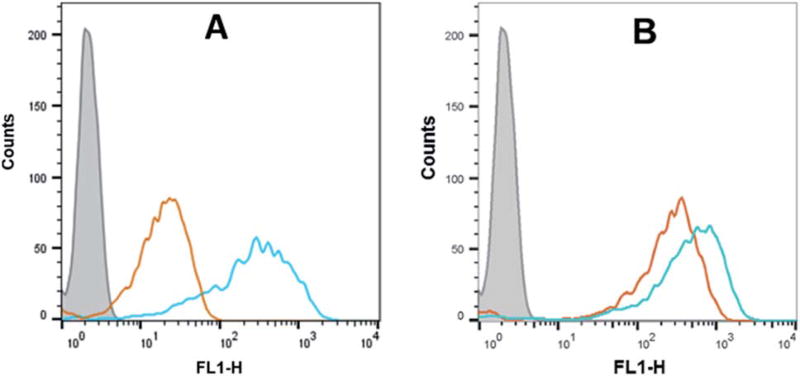
Fig. 4.
(A) Flow cytometry analysis of the dTtaPS-assisted cellular uptake of the control PMO sequence 6 (peak area with an orange border) and PNA sequence 8 (peak area with a cyan border) in HeLa pLuc 705 cells. (B) Same as in (A) but using 2′-OMeUtaPS as the delivery reagent. Gray peak area, untreated HeLa pLuc 705 cells. Experimental conditions are described in the Experimental section.

