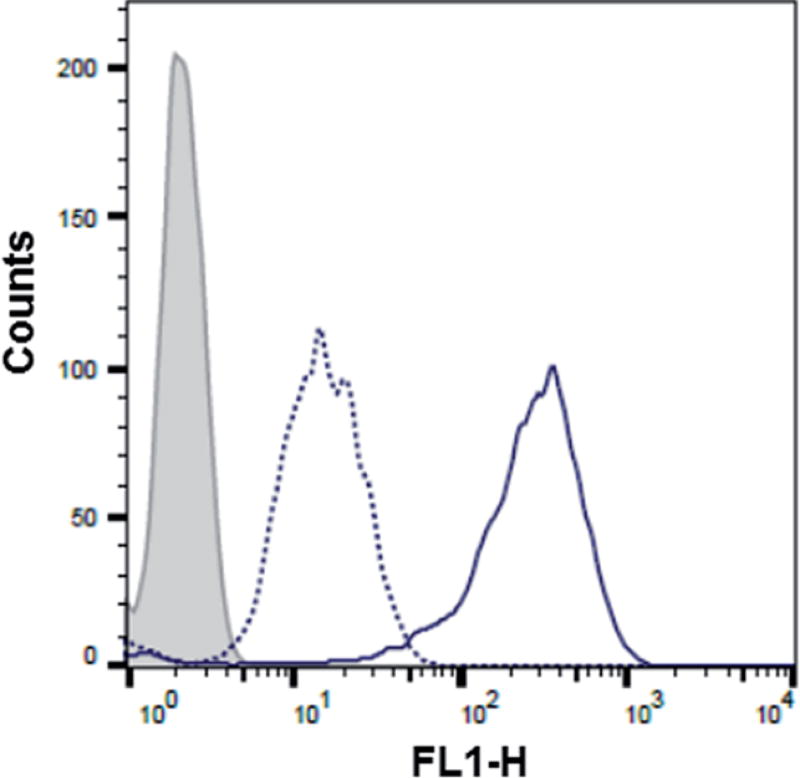
Fig. 8.
Flow cytometry analysis of the 2′-OMeUtaPS-mediated internalization of PMO sequence 5 (peak area with a solid line border) in the presence of urea (peak area with a dotted line border) in HeLa pLuc 705 cells. Gray peak area accounts for untreated HeLa pLuc 705 cells. The concentration of 5 and 2′-OMeUtaPS was 1.0 µM and 2.0 µM, respectively, while the concentration of urea is 2.0 M during the course of complex formation.

