. 2017 May 4;8(7):4987–4995. doi: 10.1039/c7sc00223h

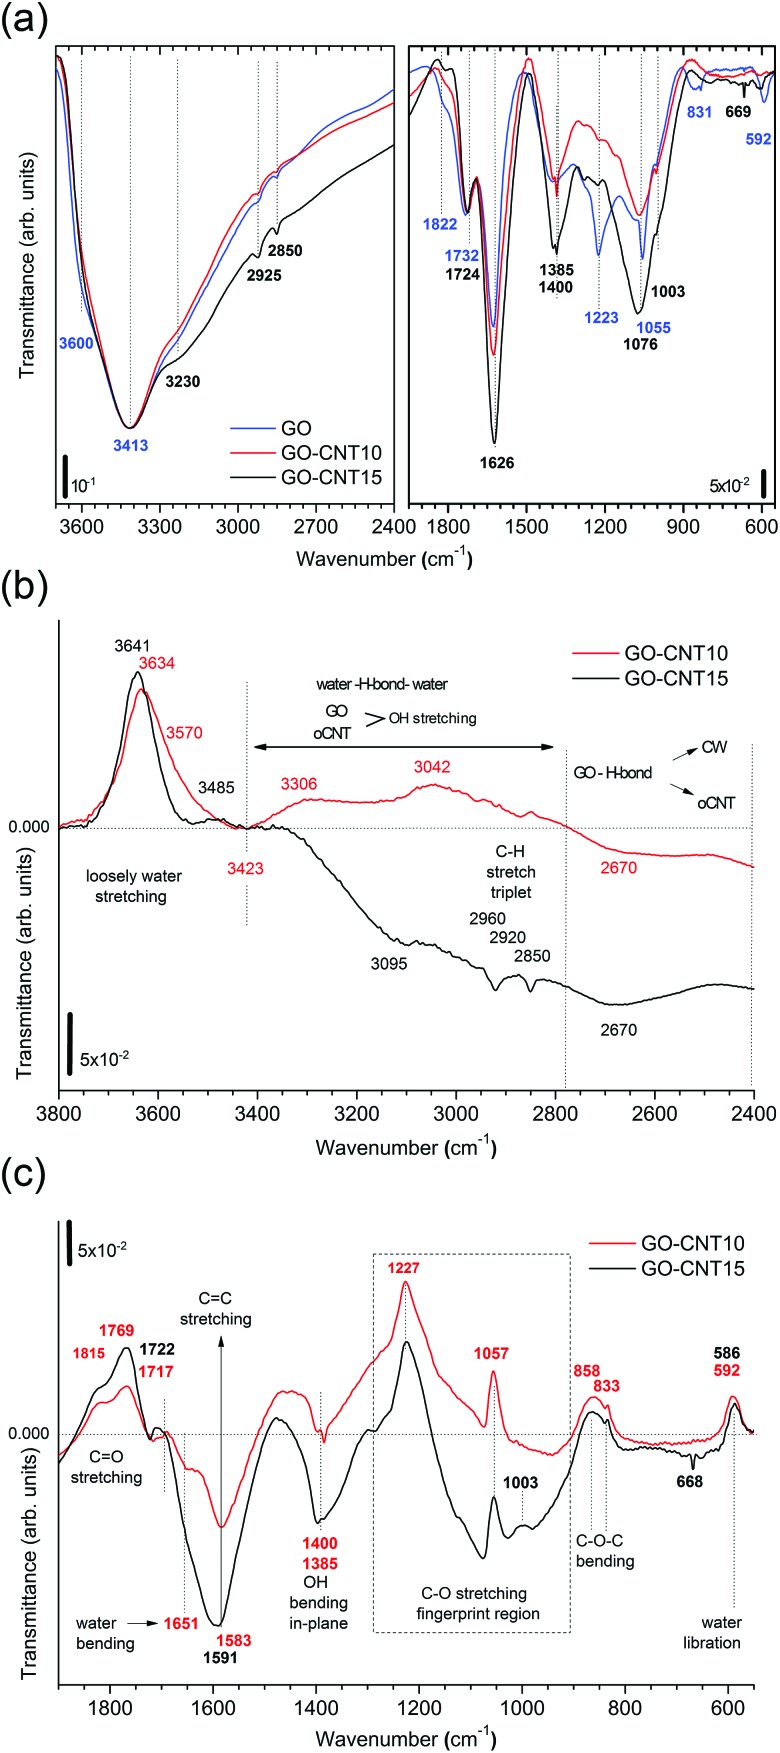
Fig. 4. (a) The FTIR spectra for GO, GO–CNT10, and GO–CNT15 presented in transmittance. The left panel shows the broad OH stretch band in the region from 3700–2400 cm–1 containing contributions from H2O and the functional groups (COOH and C–OH). The right panel depicts the region from 1950–550 cm–1 providing information on the vibrational modes for the C Created by potrace 1.16, written by Peter Selinger 2001-2019 O stretch (1850–1720 cm–1), water scissor (1650–1620 cm–1), sp2 C Created by potrace 1.16, written by Peter Selinger 2001-2019 C stretch (1500–1600 cm–1), OH in-plane bending (1400 cm–1 and 1385 cm–1), C–O stretch (1223 cm–1, 1055 cm–1 and 1003 cm–1), and C–O–C bending (831 cm–1). (b) The transmittance difference spectra obtained after subtracting the spectrum of GO showing the region from 3800 cm–1 to 2400 cm–1. The positive (upper part) and negative (lower part) values refer to the relative decrease and increase of the GO–CNT signals with respect to GO. A horizontal line marks the zero reference value throughout the wavenumber range. The zones for loosely bound water (3800–3420 cm–1), the overlap region for the OH water and oxygen functional groups from GO and oCNTs (3420–2800 cm–1), and the cooperatively strengthened OH···O Created by potrace 1.16, written by Peter Selinger 2001-2019 C hydrogen bonds between GO and oCNTs (2800–2400 cm–1) are separated by vertically dashed lines. (c) The transmittance difference spectra showing the region from 1900–550 cm–1. The different vibrational modes or respective zones are indicated.

Fig. 4