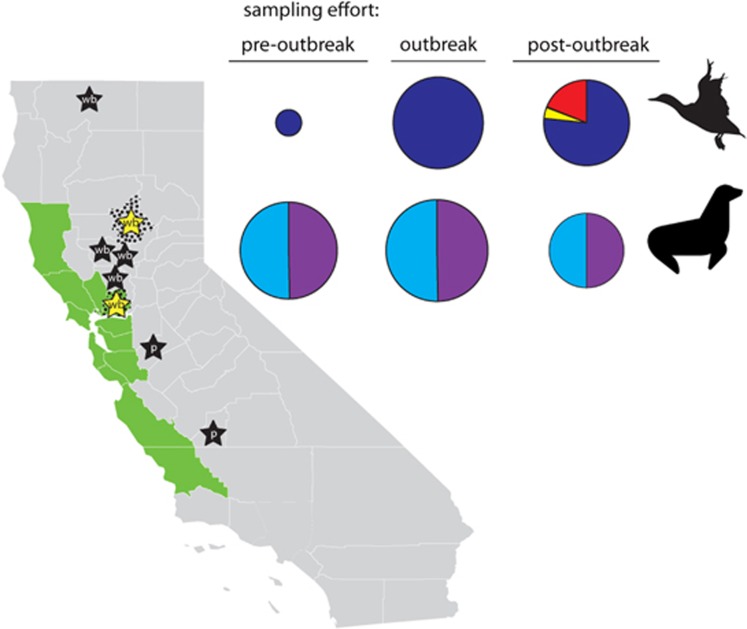
Figure 1.
Map of California depicting locations at which surveillance samples were collected as part of this study. Butte and Solano counties, where samples were collected from wild waterfowl, are indicated with black stippling. The Central California Coast (Mendocino, Sonoma, Marin, Napa, Solano, Contra Costa, Alameda, Santa Clara, San Mateo, San Francisco, Santa Cruz, Monterey and San Luis Obispo counties), where pinnipeds stranded and where samples were collected, is depicted in green. Stars represent approximate county-level locations, where highly pathogenic clade 2.3.4.4 influenza A viruses have been previously detected in California in wild birds (wb: Butte; Colusa; Siskiyou; Solano; Sutter; and Yolo counties) and in poultry (p: Kings; and Stanislaus counties). Yellow stars depict the detection of highly pathogenic clade 2.3.4.4 influenza A viruses from samples that were collected from wild waterfowl sampled in Butte and Solano counties as part of the current study. Pie charts on the right-hand side depict the relative sampling effort (size of pie chart) and proportion of each sample type (cloacal swab=dark blue; fecal swab=yellow; oropharyngeal swab=black; paired oropharyngeal/cloacal swab=red; nasal swab=light blue; and rectal swab=purple) that originated from wild waterfowl and pinnipeds during pre-outbreak (April–August 2014), outbreak (September 2014–March 2015) and post-outbreak (April–August 2015) periods. Map of California courtesy of FreeVectorMaps.com (https://freevectormaps.com/united-states/california/US-CA-EPS-01-0002).

