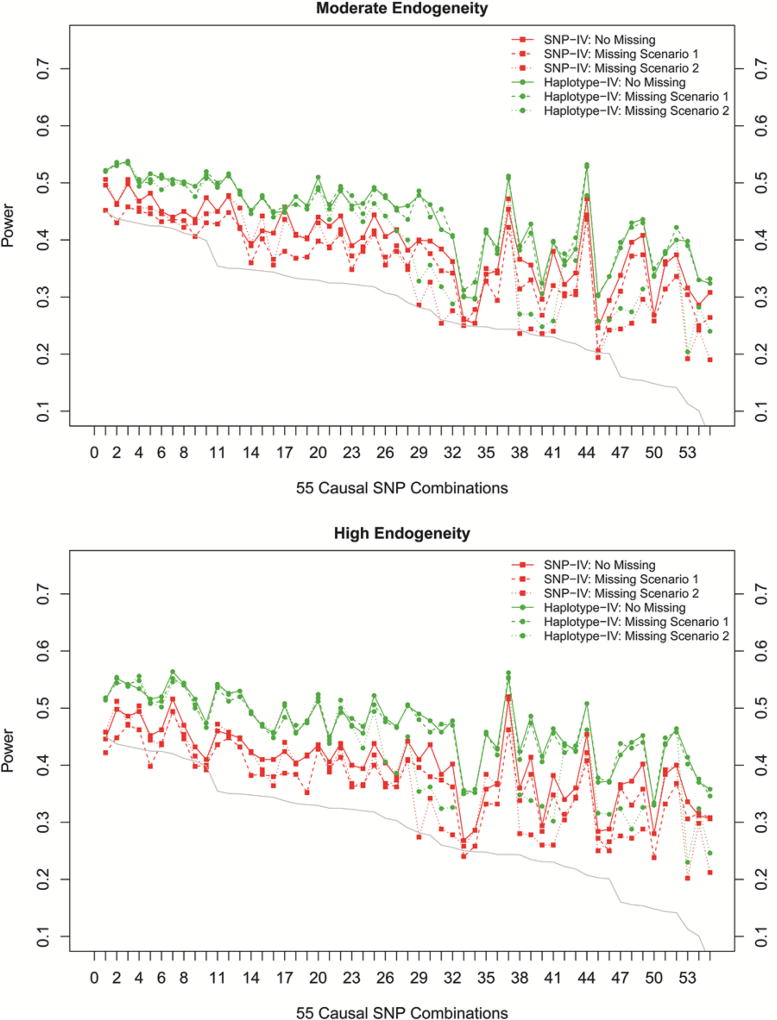
Figure 3.
Power for increased endogeneity and two missing scenarios. (a) Moderate endogeneity is set at ~10%. (b) High endogeneity is set at ~10%.Missing scenario 1:2% of genotype is missing randomly for each SNP. Missing scenario 2: it means only two causal SNPs (true instruments) are not genotyped. X-axis indicates 55 causal SNP combinations ordered along descending average adjacent R2. Left Y-axis represents the power for each SNP pair. Green color represents the haplotype-IV model, and red color represents the SNP-IV model. Gray line shows the average adjacent R2 of each combination.

