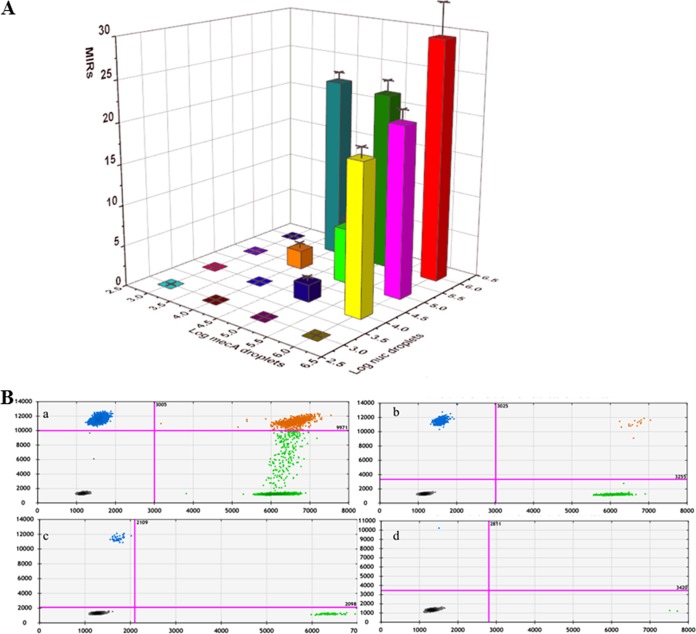
FIG 2.
The average MRSA index ratios (MIRs) (A) and two-dimensional (2D) plots (B) of duplex ddPCR for detection of the mixture of MSSA 91118 and MR-CoNS WH01 under different concentrations (a, 1 × 10⁶ CFU/ml each; b, 1 × 10⁵ CFU/ml each; c, 1 × 10⁴CFU/ml each; and d, 1 × 10³ CFU/ml each). In panel A, the x axis shows log of the number of mecA-positive droplets per ml, the y axis shows log of the number of nuc-positive droplets per ml, and the z axis (colored bars) shows the MRSA index ratio. Standard deviations are shown as error bars in the calibration curve. In panel B, the x axis shows the fluorescence amplitude corresponding to the HEX fluorophore (nuc), and the y axis represents the fluorescence amplitude corresponding to the FAM fluorophore (mecA). Each point represents a droplet with a given fluorescence level, and the droplet colors indicate which target was amplified (blue, mecA positive; green, nuc positive; black, negative; orange, both nuc and mecA positive).

