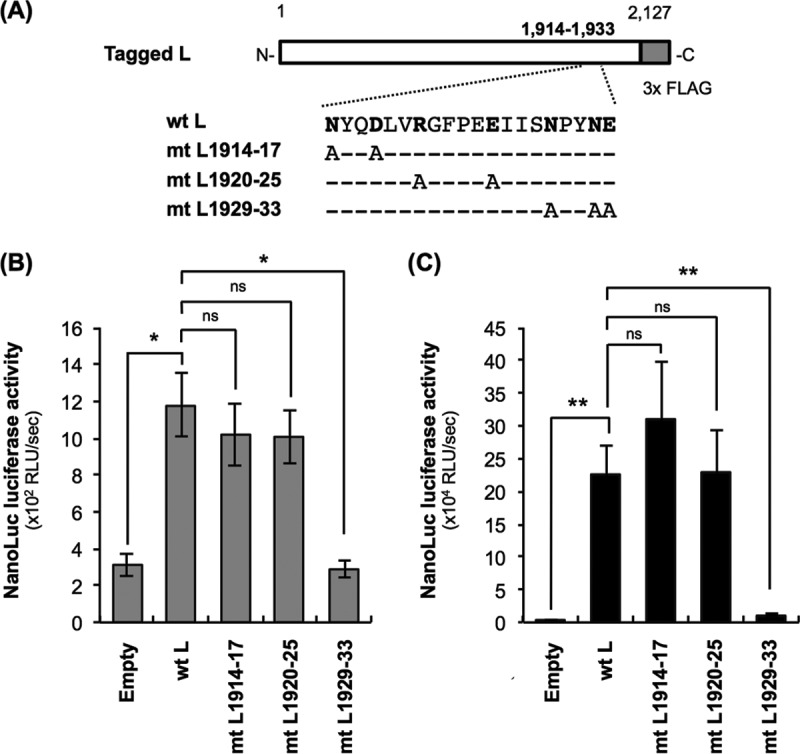
FIG 7.

Examination of the functionality of L protein mutants by the trans-complementation assay. (A) Schematic diagram of primary structures of L protein mutants used in this study. The white and gray bars represent Nishigahara L protein and 3× FLAG tag, respectively. Dashes represent the residues that are identical to those at the same positions of wtL. Hydrophilic amino acids in the region at positions 1914 to 1933, which are perfectly conserved among L proteins from a total of 11 lyssavirus species analyzed in this study (see Fig. 6), are shown in bold. (B and C) NA cells were transfected to express wtL or a series of L protein mutants (mtL1914-17, mtL1920-25, and mtL1929-33) before inoculation with Nishi-ΔL/Nluc at an MOI of 0.01. The infected cells were lysed at 9 hpi (B) or 48 hpi (C) for NanoLuc luciferase assays. All assays were carried out in triplicate and repeated three times independently. The values are means ± standard errors of the means from the three independent experiments. *, significant difference at a P value of <0.05; **, significant difference at a P value of <0.01. ns, not significant (P ≥ 0.05).
