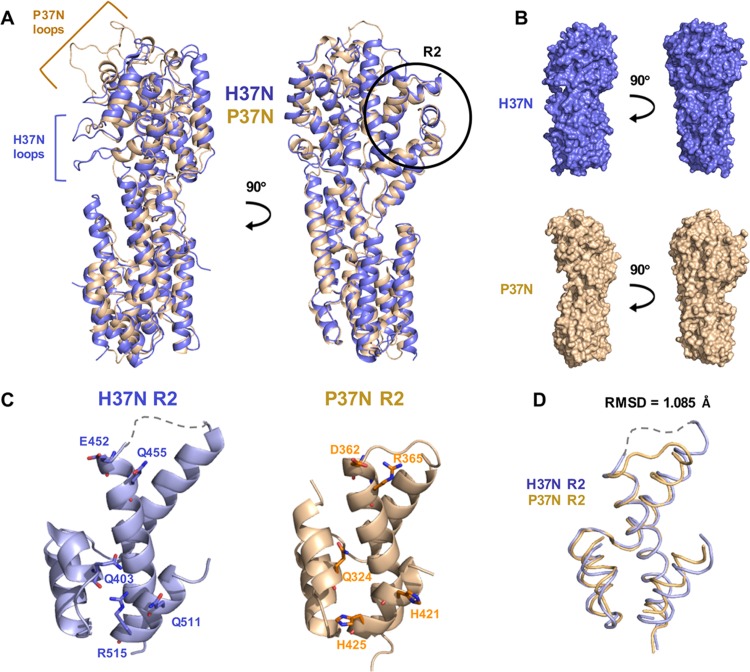
FIG 3.
Comparison of H37N and P37N structures. H37N is shown in blue and P37N in wheat. (A) Overlay of the two structures in cartoon representation shown in two orientations related by a 90-degree rotation around the vertical axis. (B) Individual structures in surface representation are shown side by side in two orientations related by a 90-degree rotation around the vertical axis. Extended loops are indicated by brackets. The R2 surface region is circled in black and labeled. (C) Close-up views of the R2 surface region in H37N and P37N. The five residues that define the R2 surface region are shown in stick representation and labeled (H37N, Q403/E452/Q455/Q511/R515; P37N, Q324/D362/R365/H421/H425). (D) Close-up of overlaid R2 region backbone with an RMSD of 1.085 Å.

