FIG 4.
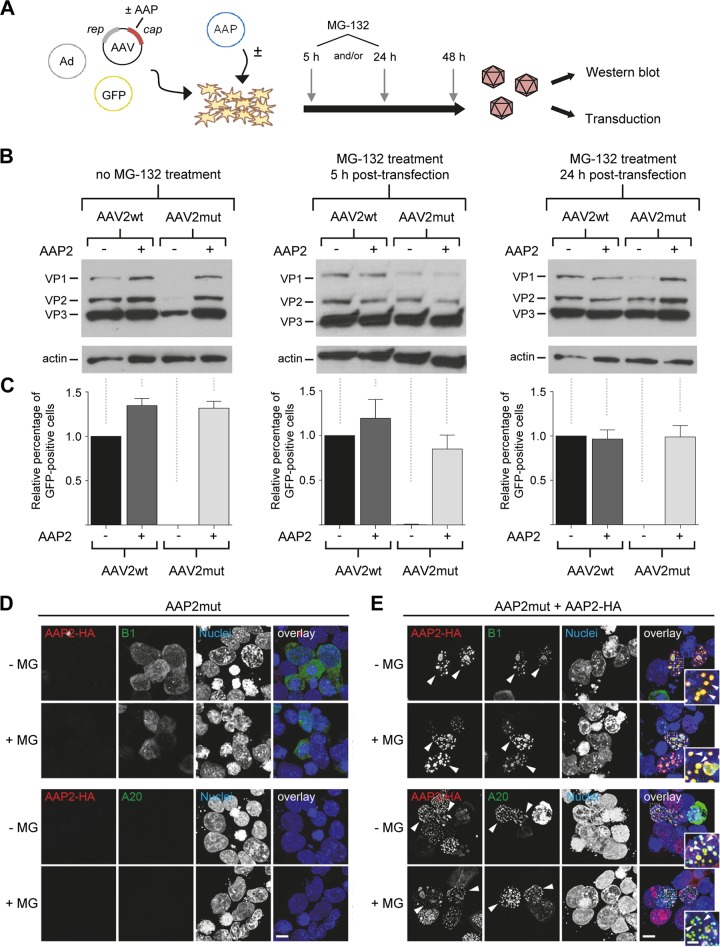
Evidence for proteasomal degradation of free VP proteins in the absence of AAP. (A) Workflow for AAV crude cell lysate production with MG-132 treatment at 5 and/or 24 h posttransfection. AAV, AAV2 helper plasmid expressing rep and cap; Ad, adenoviral helper plasmid; GFP, GFP-encoding AAV vector plasmid. (B) Western blot analysis of cell lysates obtained from the workflow in panel A. Cells were either left untreated (left blot) or incubated with MG-132 at 5 h (middle blot) and/or 24 h (right blot) after transfection. VP1 to VP3 proteins were detected with the B1 antibody. (C) Quantification of relative GFP expression in HEK293T cells at 48 h after transduction with AAV crude cell lysates (in principle, the same samples as for panel B). Positive cells were counted via flow cytometry and values normalized to the AAV2wt control without AAP2 (set to 1.0). Shown are means from three independent biological replicates plus SD. (D and E) Effect of proteasomal inhibition on AAP/VP/capsid localization. HEK293T cells were transfected with APP2mut (D) or cotransfected with AAP2mut and HA-tagged AAP2 (E) prior to staining with antibodies against free VP proteins (B1, green, upper panels) or assembled capsids (A20, green, lower panels) or DAPI (nuclei). The images illustrate the localization of AAP2 (red) and VP/capsid (B1 or A20, green) in the presence or absence of MG-132. Overlay images are shown on the right side of each panel. Arrowheads highlight examples of clear VP/capsid (B1/A20) and AAP2 colocalization in the nuclei of transfected cells. Insets show a higher magnification of selected areas. The images shown are maximum projections of deconvolved confocal optical sections spanning the entire volume of cells. All images are representative of three independent experiments. Scale bar, 5 μm; scale bar in insets, 2 μm.

