FIG 1.

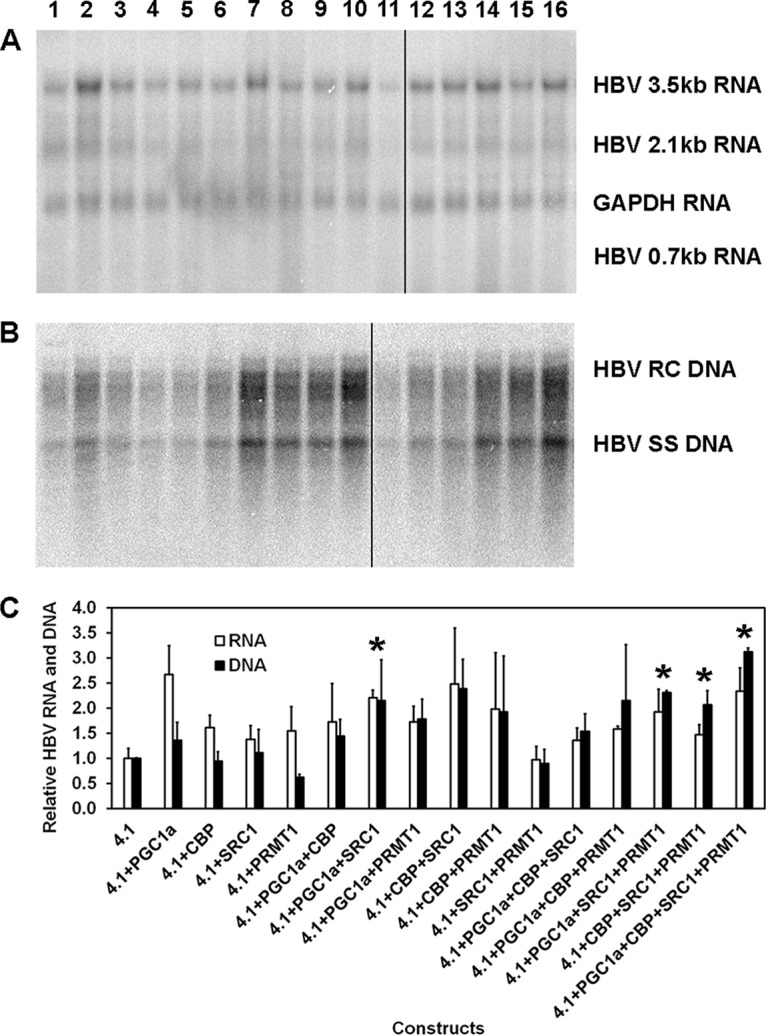
Effects of transcriptional coactivators on HBV biosynthesis in the human hepatoma cell line Huh7. (A) RNA (Northern) filter hybridization analysis of HBV transcripts. The glyceraldehyde-3-phosphate dehydrogenase (GAPDH) transcript was used as an internal control for RNA loading per lane. The black line indicates noncontiguous lanes from a single filter hybridization analysis. (B) DNA (Southern) filter hybridization analysis of HBV replication intermediates. HBV RC DNA, HBV relaxed circular DNA; HBV SS DNA, HBV single-stranded DNA. Cells were transfected with the HBV DNA (4.1-kbp) construct (lanes 1 to 16) plus PGC1α (lanes 2, 6 to 8, 12 to 14, and 16), CBP (lanes 3, 6, 9, 10, 12, 13, 15, and 16), SRC1 (lanes 4, 7, 9, 11, 12, and 14 to 16), and PRMT1 (lanes 5, 8, 10, 11, and 13 to 16) expression vectors, as indicated. The black line indicates noncontiguous lanes from a single filter hybridization analysis. (C) Quantitative analysis of the HBV 3.5-kb RNA and HBV DNA replication intermediates. The levels of the HBV 3.5-kb RNA and total HBV DNA replication intermediates are reported relative to the value for the HBV DNA (4.1-kbp) construct (lane 1). The mean RNA and DNA levels plus standard deviations from two independent analyses are shown. Levels of the transcripts (lane 7) and replication intermediates (lanes 14 to 16) in coactivator-expressing cells that are statistically significantly higher than the levels in cells transfected with the HBV DNA (4.1-kbp) construct only (lane 1), as determined by Student's t test (P < 0.05), are indicated with an asterisk.
