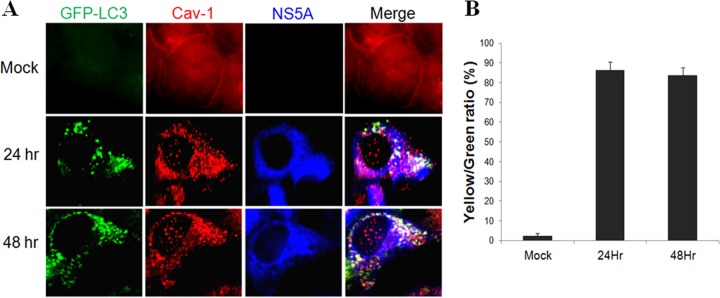
FIG 6.
Colocalization of lipid rafts with autophagosomes in HCV-infected cells. (A) Fluorescence imaging of GFP-LC3, Cav-1, and HCV NS5A in mock-infected and HCV-infected cells. Stable Huh7 cells that expressed GFP-LC3 were infected with HCV (multiplicity of infection, 1), fixed at the time points indicated, and stained for Cav-1 (red) and NS5A (blue). (B) Percentages of GFP-LC3 puncta that were positive for Cav-1 (i.e., yellow/green ratio). The results represent the average from >50 cells that were analyzed.

