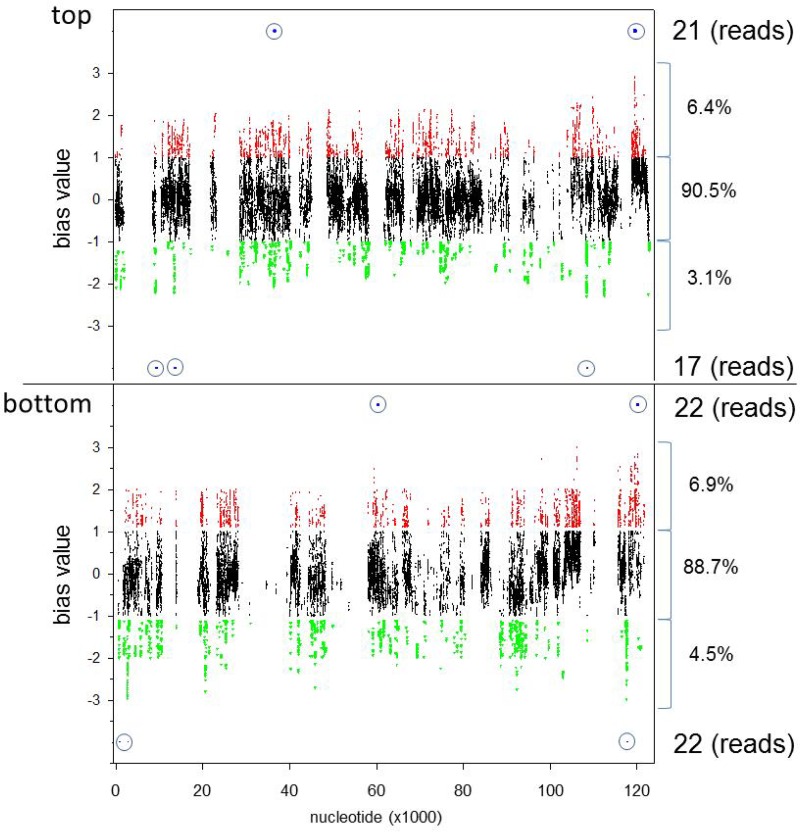
FIG 8.
Bias value plot for VZV-DEN09 transcripts. Bias values were determined from transcriptome analysis for all nucleotide locations on both top and bottom DNA strands of VZV-DEN09. Bias values of >1 (red dots) indicate nucleotide locations with >2-fold the expected counts per nucleotide (cpn) in enriched samples. Bias values of <−1 (green dots) indicate nucleotide locations with <2-fold less than the expected cpn in enriched samples. Bias values between −1 and 1 (black dots) indicate nucleotide locations with cpn within 2-fold of the expected value. Percentages of total cpn that reside within each area are listed on the right. Total numbers and locations of cpn from 51-nucleotide reads residing outside the 2-fold expected value are listed on the right, with relative location shown by dots within blue circles.

