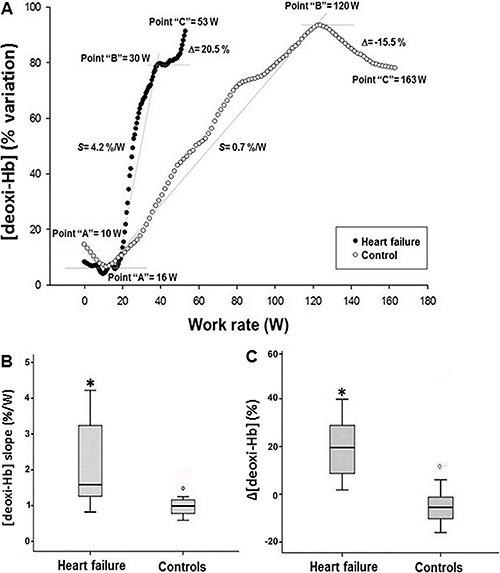
Figure 2. Representative deoxygenated hemoglobin concentration (deoxi-Hb) response profile (% rest-peak variation) as a function of increasing exercise intensity in a representative control and a patient with heart failure (panel A). Lower panels show box plots comparing the slope of deoxi-Hb increase as a function of work rate throughout phase “2” (panel B) and Δdeoxi-Hb difference between points “B” and “C” (panel C). Data are reported as means±SD. Variables: [deoxi-Hb] Slope (S): Slope of the ratio [deoxi-Hb]/work-rate (%variation/W); Δ[deoxi-Hb] (Δ): variation of [deoxi-Hb] at the maximum work-rate point (C) to the second inflection point (B). *P<0.05: Unpaired t-test (panel B) and Mann-Whitney test (panel C).

