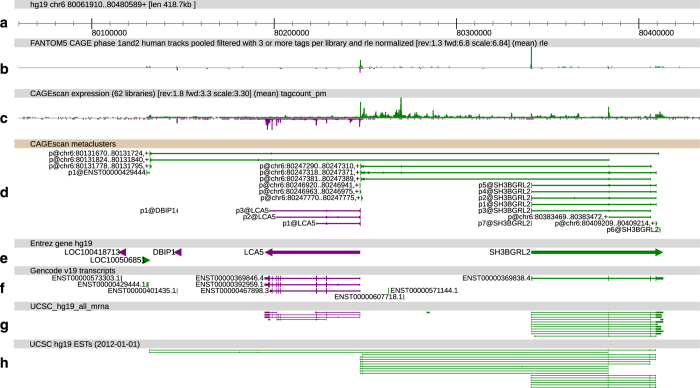
Figure 1. ZENBU view of CAGEscan data.
CAGEscan clusters revealing new promoters for the SH3BGRL2 gene. Features on the plus and minus strand are displayed in green and purple respectively. Promoter regions of interest are highlighted with ellipses in track D. (a) Genomic coordinates. (b) FANTOM5 CAGE signal as a quantitative histogram. (c) CAGEscan CAGE signal. (d) CAGEscan meta-clusters, combining pairs for all libraries. The name of the seed CAGE peak is indicated on the left of each cluster. (e) NCBI Gene bodies. (f) GENCODE 19 annotations. (g) GenBank mRNA sequences. (h) EST sequences supporting the CAGEscan clusters.

