
Fig. 5.
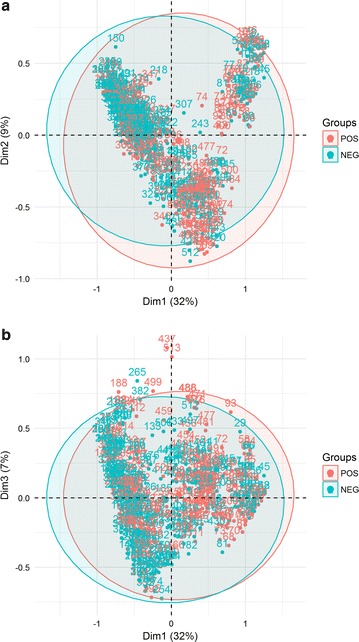
Distribution of households in the a 1 × 2 dimension MCA factor map, and b the 1 × 3 dimension MCA factor map. Colors indicate the status of the household according to the presence of at least one member with malaria in the last 12 months
Official websites use .gov
A
.gov website belongs to an official
government organization in the United States.
Secure .gov websites use HTTPS
A lock (
) or https:// means you've safely
connected to the .gov website. Share sensitive
information only on official, secure websites.
Distribution of households in the a 1 × 2 dimension MCA factor map, and b the 1 × 3 dimension MCA factor map. Colors indicate the status of the household according to the presence of at least one member with malaria in the last 12 months