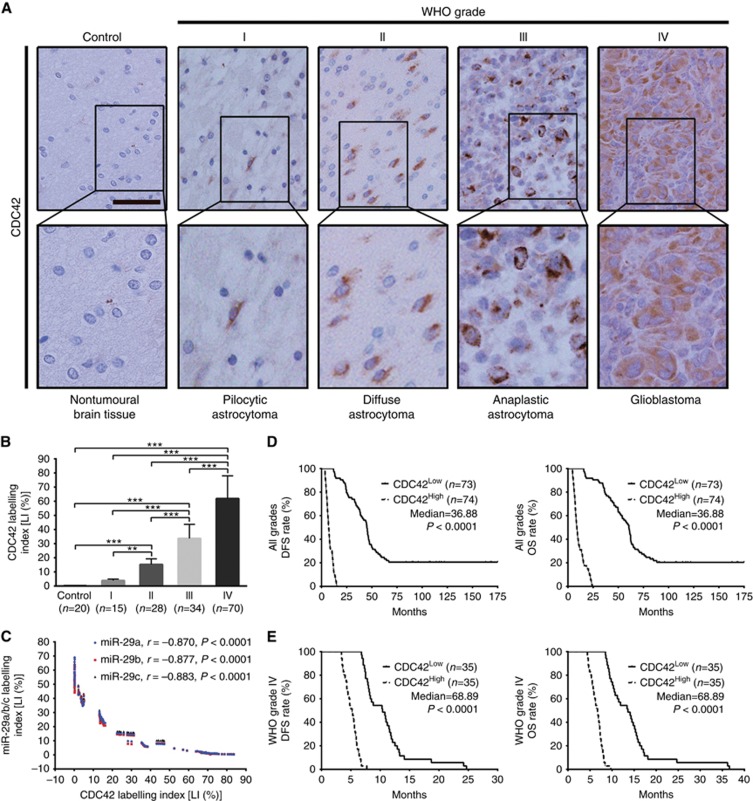
Figure 6.
CDC42 expression correlates with glioma grades, miR-29a/b/c expressions and patients’ prognoses. (A) Representative images of CDC42 IHC detection. Scale bar, 50 μm. (B) Comparisons among groups of CDC42 expression level (Labelling index, LI (%)) in the FFPE samples of 147 gliomas and 20 nontumoural control brain tissues. The CDC42 LI (%) of each sample was calculated as described in Figure 1. The data in B are presented as the mean±s.d. **P<0.01; ***P<0.001. (C) Pearson correlation analysis between CDC42 and miR-29a/b/c expressions in the above FFPE samples. (D and E) Kaplan–Meier analyses of the correlation between CDC42 and DFS (left) or OS (right) of all grade glioma patients (D) and WHO grade IV glioblastoma patients (E). Patients were stratified into high- and low-expression subgroups using the median of CDC42 LIs.

