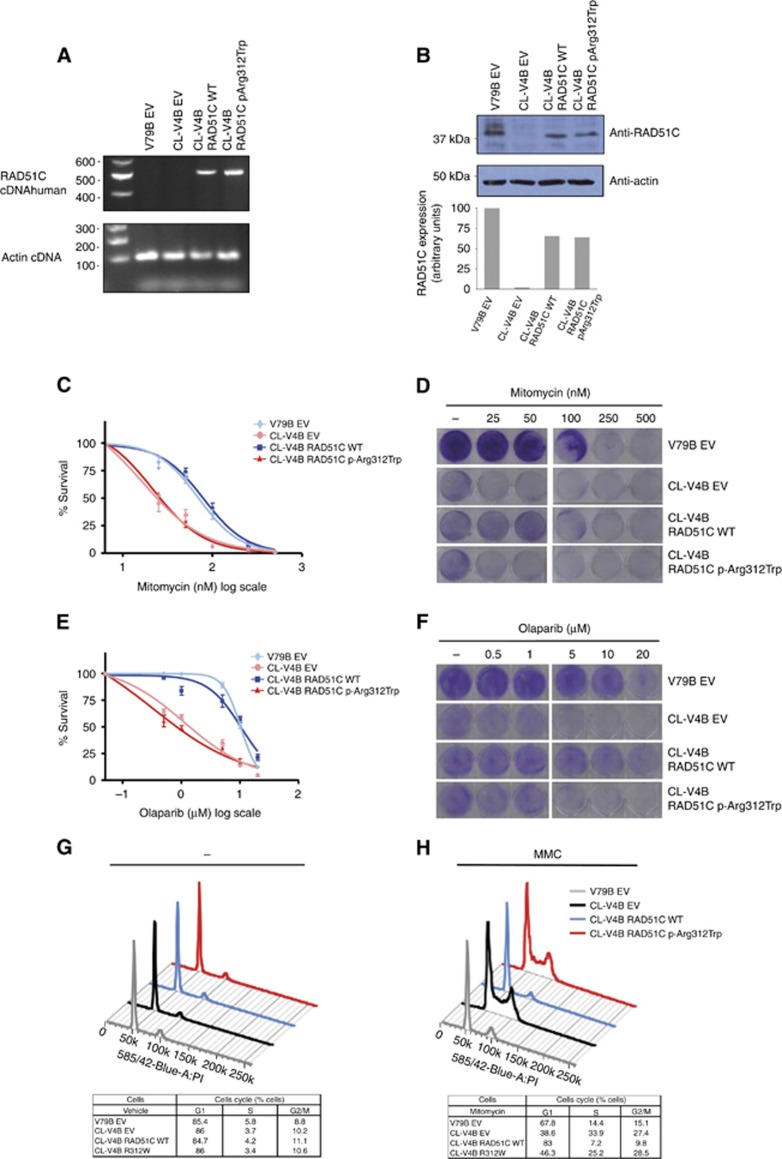
Figure 2.
Functional characterisation of RAD51C p.Arg312Trp missense variant. (A) RT–PCR expression analysis of RAD51C transgenic cDNA in RAD51C-deficient CL-V4B cells transduced with wild-type (CL-V4B RAD51C WT) or p.Arg312Trp–containing (CL-V4B RAD51C.p.Arg312Trp) human RAD51C. CL-V4B (CL-V4B EV) and RAD51C wild-type expressing V79B cells (V79B EV) transduced with empty vector were included as controls. Primers were designed to specifically amplify human RAD51C. (B) Verification and quantification of RAD51C protein expression levels in transgenic cells by using immunoblotting analysis with an anti-RAD51C antibody that recognises human and hamster RAD51C. CL-V4B RAD51C WT, CL-V4B RAD51C.p.Arg312Trp and control CL-V4B EV and V79B EV cells were treated with increasing MMC (C) and Olaparib (E) doses and survival was examined after 5 days of treatment. Values represent means±standard error of the mean (s.e.m.) of four independent experiments. Representative visual examination of cell survival assays by using crystal violet staining of MMC-treated (D), Olaparib-treated (F) and vehicle-treated cells. Plating efficiency differences between CL-V4B and V79B were accounted for by normalising each treated V79B and CL-V4B cell counting with its corresponding untreated (control) point. Cell cycle analysis of CL-V4B RAD51C WT, CL-V4B RAD51C.p.Arg312Trp and control cells treated with MMC (50 nM) (H) or vehicle (–) (G). Low panels show percentage of cells in G1, S and G2/M phases in each cell line. Data are means of four independent experiments. A full colour version of this figure is available at the British Journal of Cancer journal online.

