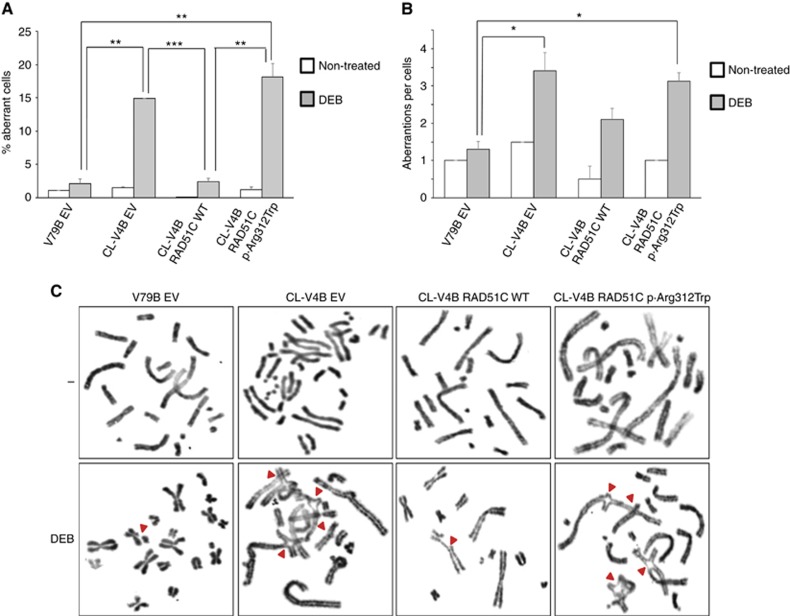
Figure 4.
DEB-induction chromosomal fragility test. Percentage of aberrant cells (A) and number of aberrations per aberrant cell (B) were evaluated in CL-V4B RAD51C WT, CL-V4B RAD51C.p.Arg312Trp and control CL-V4B EV and V79B EV cells, after 48 h of treatment with DEB (0.06 μg ml−1) or with vehicle (non-treated). * P<0.05; ** P<0.01; *** P<0.001. Results are shown as mean±s.e.m. of two replicates. (C) Representative images (× 100) of each condition are shown. A full colour version of this figure is available at the British Journal of Cancer journal online.

