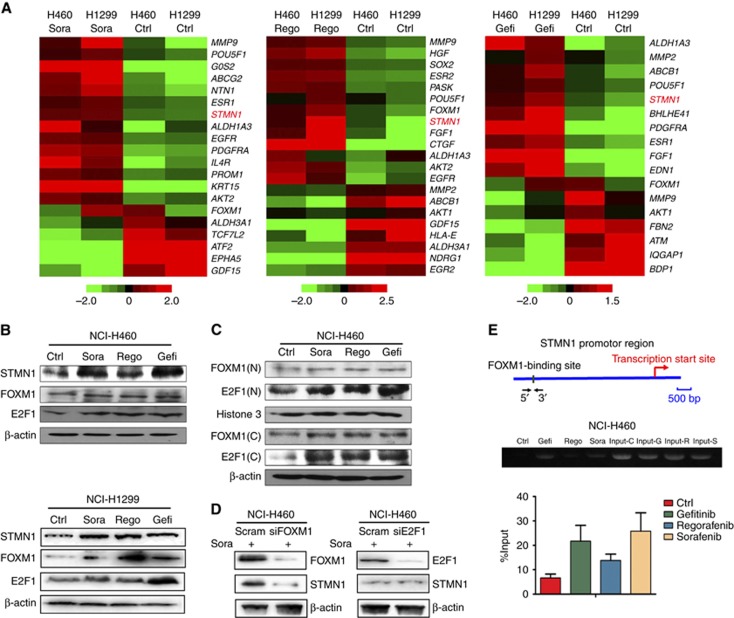
Figure 3.
Microarray gene expression analysis and STMN1 regulation in TKI-pretreated NSCLC cells. (A) Heat maps depicting the differential expression of tumour-related signature genes in TKI-pretreated and control NCI-H460 and NCI-H1299 cells. Red and green indicate high and low mRNA expression levels, respectively. (B) The expression levels of STMN1, FOXM1, and E2F1 were detected by western blot in TKI-pretreated and control NCI-H460 and NCI-H1299 cells. β-actin was used as a loading control. (C) The subcellular distribution of FOXM1 and E2F1 in TKI-pretreated NCI-H460 cells. Histone3 was detected as a nuclear control, and β-actin was used as a cytoplasmic control. N, nuclear; C, cytoplasmic. (D) The expression of STMN1 and FOXM1, or STMN1 and E2F1, was assessed in sorafenib-pretreated NCI-H460 cells after knockdown of FOXM1 or E2F1, respectively, by siRNA (50 nM). (E) ChIP assays confirm the binding of FOXM1 to the promoter region upstream of the STMN1 gene. All error bars are s.e.m.

