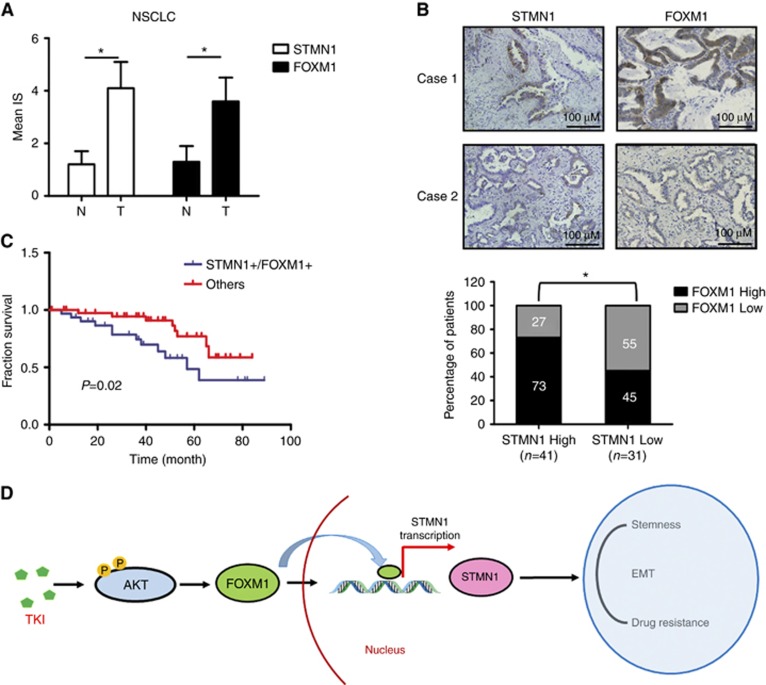
Figure 6.
The expression of STMN1 and FOXM1 in normal human lung tissues and NSCLCs. (A) The expression levels of STMN1 and FOXM1 in NSCLC tissues and adjacent normal tissues. Abbreviations: N, normal tissue; T, tumour tissue. *P<0.05, compared with normal(N) tissues. (B) The expression of STMN1 and FOXM1 in representative NSCLC tissues (top). Images are magnified × 200. The correlation between STMN1 and FOXM1 expression in NSCLC tumour tissues (bottom). *P<0.05, compared between two groups. (C) Overall survival of patients according to expression of STMN1 together with FOXM1 in NSCLC tumour tissues. (D) Schematic figure illustrating how TKIs enrich CSCs, induce EMT, and trigger drug resistance in NSCLC cells. Phosphorylation is indicated by P in yellow circles.

