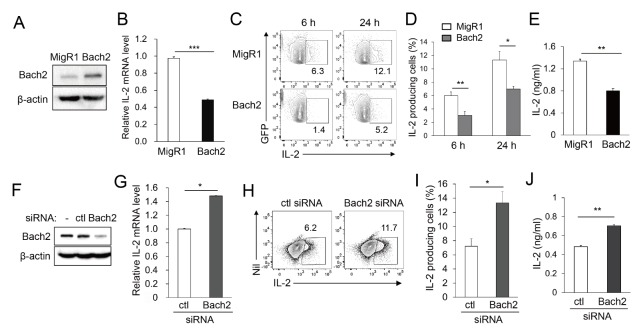
Fig. 1.
IL-2 varies inversely with Bach2. Jurkat T cells were transfected with MigR1, MigR1–Bach2, or Bach2-specific or control (ctl) siRNA and assayed by immunoblotting (A and F). The transfectants were stimulated with PMA/ionomycin for 16 hours and assayed by qRT-PCR (B and G), for 6 or 24 hours and assayed by FACS (C, D, H and I). The culture supernatants were collected and assayed by ELISA (E and J). Representative FACS profiles with the percentage of cells in the indicated area (C and H) and percentages of IL-2-producing cells (D and I) are shown. All data are representative of three independent experiments. Nil, no staining. *P < 0.05, **P < 0.01 and ***P < 0.001 by Student’s t-test.

