Fig. 3.
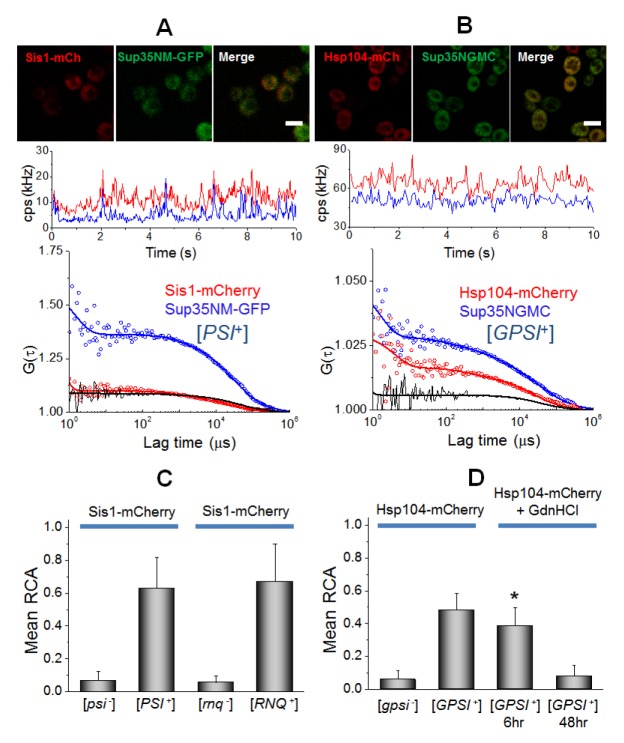
Quantification of interaction between Sup35 oligomers and remodeling factors, Sis1 and Hsp104 in live cells. (A) Confocal image of [PSI+] cells co-expressing Sis1-mCherry and Sup35NM-GFP and (B) image of [GPSI+] cells co-expressing Hsp104-mCherry and Sup35NGMC are shown (upper). Scale bar, 5 μm. Representative FCCS measurement carried on the cells are shown (central and bottom). (C) The mean values of relative cross-correlation amplitudes (RCA) between Sis1-mCherry and Sup35NM-GFP in [psi−] and [PSI+] cells and between Sis1-mCherry and Rnq1-GFP in [rnq−] and [RNQ+] cells are shown. (D) The mean RCA values between Hsp104-mCherry and Sup35-GFP in [gpsi−] and [GPSI+], and GdnHCl treated [GPSI+] cells during 6 hr and 48 hr are shown. Error bars represent the s.d. *P < 0.05 compared with that in non-treated [GPSI+] cells.

