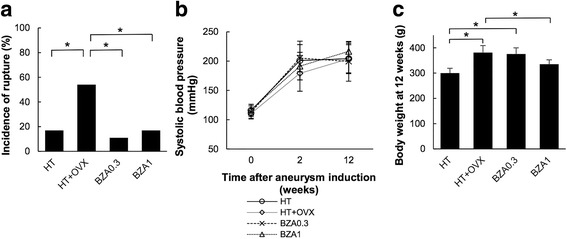
Fig. 1.

a Incidence of aneurysm rupture within 12 weeks after aneurysm induction (*p < 0.05, Fisher’s exact test). b Sequential changes in the systolic blood pressure (*p < 0.05 vs sham, Scheffe’s test). c The body weight at 12 weeks after aneurysm induction (*p < 0.05, Scheffe’s test). Data are the mean ± SD. n = 23 – 27 per group
