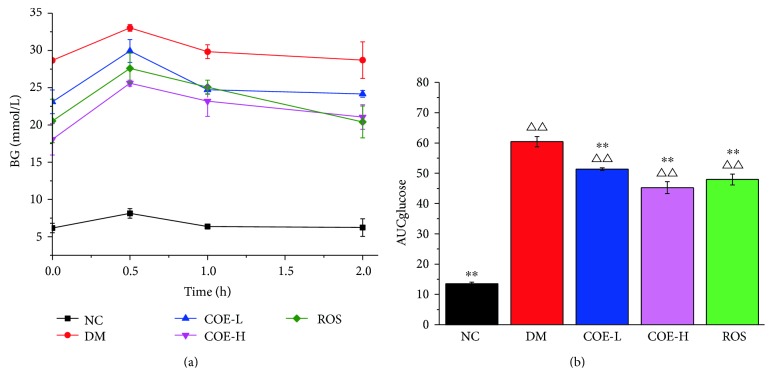
Figure 1.
Effects of COE on oral glucose tolerance test (OGTT) (a) and area under curve (AUC) (b) in diabetic model mice. BG: blood glucose level. AUCglucose represented area under curve was calculated from blood glucose level. Mice were supplemented with COE at 50 (COE-L) or 200 (COE-H) mg/kg body weight and rosiglitazone at 4 mg/kg body weight (ROS) for 3 weeks. Data were presented as mean ± standard deviation (n = 3). ∗∗P < 0.01 compared to group DM; ΔΔP < 0.01 compared to group NC.

